Download presentation
Presentation is loading. Please wait.

1
Some spatial modelling examples for discussion Marian Scott NERC September 2011

2
ECCOMAGS Project Funded by EC FPV – Nuclear Safety, Partners –BfS (Germany), CEA (France), DEMA/DTU (Denmark), GBA (Austria), HSK (Switzerland), IGM (Portugal), SSI (Sweden), SGU (Sweden), STUK (Finland), SURRC (UK) Airborne Gamma-ray Spectrometry (AGS) T o assess comparability of the European AGS systems To assess comparability of AGS with ground- based systems.
, CEA (France), DEMA/DTU (Denmark), GBA (Austria), HSK (Switzerland), IGM (Portugal), SSI (Sweden), SGU (Sweden), STUK (Finland), SURRC (UK) Airborne Gamma-ray Spectrometry (AGS) T o assess comparability of the European AGS systems To assess comparability of AGS with ground- based systems.")
3
Exercise Survey Areas

4
Three spatial scales of measurement: –Ground based soil sampling –In-situ monitoring –Aerial monitoring How comparable are the three sets of measurement? What issues do we need to consider (downscaling/upscaling)?
 .")
5
Ground sampling locations

6
Pre-Characterisation-sampling plan for in-situ measurement Expanding hexagonal sampling pattern showing the radial numbers and shell designations.

7
137 Cs Map 6 th June

8
Area X – 137 Cs

9
Example: Mapping SO 2 over Europe and through time How has SO 2 levels changed over time as a result of international agreements? How is SO 2 distributed over Europe? A spatial model (over Europe), which may change over time- a spatio-temporal model
, which may change over time- a spatio-temporal model.")
15
Example: River quality over a river basin How have nitrate levels changed over time as a result of changes in management and diffuse pollution control? How are nitrate levels distributed over river basin? A spatio-temporal model

16
some comments modelling over space and time is challenging- it lies at much of the controversies we have seen about climate change predictions some simple approaches are to look at each spatial location over time, to look at each spatial pattern at each timepoint A spatio-temporal model combines these approaches and may introduce an interaction, so that the change over time is not uniform over space

19
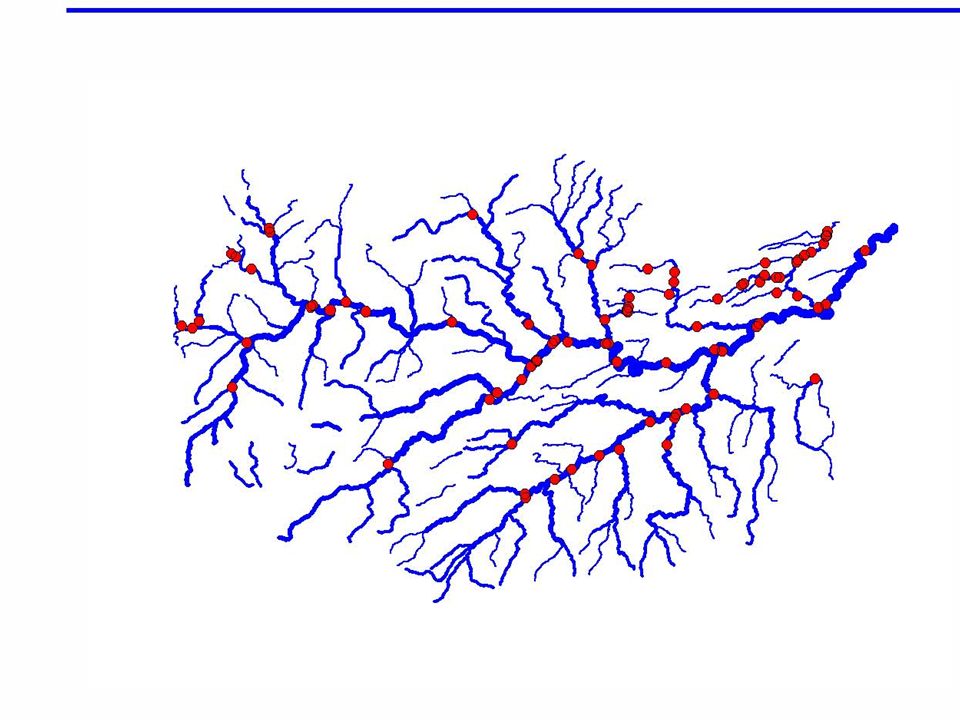
Spatial patterns of change- at river basin scale Spatial patterns of change may be important interpolation over the entire network from the stations is possible, but needs a spatial model-a river distance model (where river distance is defined as the shortest distance between two locations, along the river network) is useful the circles represent the stations on the network, clearly not spatially representative Joint work with David ODonnell, Mark Hallard (SEPA), Adrian Bowman
 is useful the circles represent the stations on the network, clearly not spatially representative Joint work with David ODonnell, Mark Hallard (SEPA), Adrian Bowman")
20
Spatial patterns of change- at river scale- the river Dee Joint work with Stephen Reid, David ODonnell, Mark Hallard (SEPA), Adrian Bowman euclidean river
, Adrian Bowman euclidean river")
21
21 Outline Variation General sampling principles Methods of sampling –Simple random sampling –Stratified sampling –Systematic sampling –How many samples (power calculations)
")
22
22 network design-ECN

23
23 Variation Natural variation in the attribute of interest, might be due to –feeding habits if measuring sheep, rainfall patterns if measuring plants Also variation/ uncertainty due to analytical measurement techniques. Natural variation may well exceed the analytical uncertainty Expect therefore that if you measure a series of replicate samples, they will vary and if there is sufficient you may be able to define the distribution of the attribute of interest.

24
24 Statistical sampling The use of valid statistical sampling techniques increases the chance that a set of specimens (the sample, in the collective sense) is collected in a manner that is representative of the population. Statistical sampling also allows a quantification of the precision with which inferences or conclusions can be drawn about the population.

25
25 Statistical sampling the issue of representativeness is important because of the variability that is characteristic of environmental measurements. Because of variability within the population, its description from an individual sample is imprecise, but this precision can be described in quantitative terms and improved by the choice of sampling design and sampling intensity (Peterson and Calvin, 1986).
..")
26
26 Good books The general sampling textbooks by Cochran (1977) and Thompson (1992), the environmental statistics textbook by Gilbert (1987), and papers by Anderson-Sprecher et al. (1994), Crepin and Johnson (1993), Peterson and Calvin (1986), and Stehman and Overton (1994).
, Crepin and Johnson (1993), Peterson and Calvin (1986), and Stehman and Overton (1994)..")
27
27 Know what you are setting out to do before you start describing a characteristic of interest (usually the average), describing the magnitude in variability of a characteristic, describing spatial patterns of a characteristic,mapping the spatial distribution, quantifying contamination above a background or specified intervention level detecting temporal or spatial trends, assessing human health or environmental impacts of specific facilities, or of events such as accidental releases, assessing compliance with regulations
, describing the magnitude in variability of a characteristic, describing spatial patterns of a characteristic,mapping the spatial distribution, quantifying contamination above a background or specified intervention level detecting temporal or spatial trends, assessing human health or environmental impacts of specific facilities, or of events such as accidental releases, assessing compliance with regulations")
28
28 Rules Rule 1: specify the objective Rule 2: use your knowledge of the environmental context

29
29 Use your scientific knowledge the nature of the population such as the physical or biological material of interest, its spatial extent, its temporal stability, and other important characteristics, the expected behaviour and environmental properties of the compound of interest in the population members, the sampling unit (i.e., individual sample or specimen), the expected pattern and magnitude of variability in the observations.
, the expected pattern and magnitude of variability in the observations.")
30
30 What is the population? The concept of the population is important. The population is the set of all items that could be sampled, such as all fish in a lake, all people living in the UK, all trees in a spatially defined forest, or all 20-g soil samples from a field. Appropriate specification of the population includes a description of its spatial extent and perhaps its temporal stability

31
31 What is the sampling unit? The environmental context helps define the sampling unit. It is not practical to consider sampling units so small that their concentration cannot be easily measured. to consider extremely large sampling units, if they are too difficult to manipulate or process. A sampling unit is a unique element of the population that can be selected as an individual sample for collection and measurement.

32
32 Sampling units In some cases, sampling units are discrete entities (i.e., animals, trees), but in others, the sampling unit might be investigator-defined, and arbitrarily sized. Statistical sampling leads to a description of the sampled members of the population and inference(s) and conclusion(s) about the population as a whole.
 and conclusion(s) about the population as a whole..")
33
33 Representativity An essential concept is that the taking of a sufficient number of individual samples should provide a collective sample that is representative of all samples that could be taken and thus provides a true reflection of the population. A representative collective sample should reflect the population not only in terms of the attribute of interest, but also in terms of any incidental factors that affect the attribute of interest. Representativeness of environmental samples is difficult to demonstrate. Usually, representativeness is considered justified by the procedure used to select the samples.

34
34 5 step approach Define the objectives and questions to be answered Summarize the environmental context for the quantities being measured. Identify the population, including spatial and temporal extent. Select an appropriate sampling design. Document the sampling design and its rationale.

35
35 Methods Simple random sampling With simple random sampling, every sampling unit in the population has, in theory, an equal probability of being included in the sample. The resulting estimator based on such a sample will be unbiased, but it may not be efficient, in either the statistical or practical senses. Simple random sampling designs are easy to describe but may be difficult to achieve in practice.

36
36 Population of N units-10 randomly selected 1 234 5 9 17 2325 3133 4245 465154 Random digits: 5,17,23, 25, 31, 33,42, 45,46,51

37
37 Sample mean and variance

38
38 Sampling error the sampling fraction f is usually very small and given by n/N.

39
39 Methods Stratified sampling The population is divided into strata, each of which is likely to be more homogeneous than the entire population. In other words, the individual strata have characteristics that allow them to be distinguished from the other strata, and such characteristics are known to affect the measured attribute of interest. Some ordinary sampling method (e.g., a simple random sample or systematic sample) is used to estimate the properties of each stratum.
 is used to estimate the properties of each stratum..")
40
40 Methods Stratified sampling Usually, the proportion of sample observations taken in each stratum is similar to the stratum proportion of the population, but this is not a requirement. If good estimates are wanted for rare strata that have a small occurrence frequency in the population, then the number of samples taken from the rare strata can be increased. Stratified sampling is more complex and requires more prior knowledge than simple random sampling, and estimates of the population quantities can be biased if the stratum proportions are incorrectly specified.

41
41 Methods Systematic sampling Systematic sampling is often more practical than random sampling because the procedures are relatively easy to implement in practice, but this approach may miss important features if the quantity being sampled varies with regular periodicity and the sampling scheme has similar periodicity.

42
42 Methods Systematic sampling Systematic sampling is probably the most commonly used method for field sampling. It is generally unbiased as long as the starting point is randomly selected and the systematic rules are followed with care. Line transects and two dimensional grids are specific types of systematic samples that are described in more detail in the spatial section.

43
43 Population of N (9x6) units-9 systematically selected 12345 6 1218 24 3036 42 4854 Systematic selection: 6,12,18,24,30,36,42, 48
 units-9 systematically selected Systematic selection: 6,12,18,24,30,36,42, 48")
44
44 Number of samples needs you to state the desired limits of precision for the population inference (how precisely does one want to know the average PCB concentration, or, what size of difference is needed to be detected and with what precision?), state the inherent population variability of the attribute of interest, and derive an equation which relates the number (n) of samples with the desired precision of the parameter estimator and the degree of significance (the chance of being wrong in the inference).
, state the inherent population variability of the attribute of interest, and derive an equation which relates the number (n) of samples with the desired precision of the parameter estimator and the degree of significance (the chance of being wrong in the inference).")
45
45 Number of samples What is the power? Power is a probability, it is the probability that we correctly conclude that the null hypothesis should be rejected. The null would say there is no difference/no effect/no trend. We want a high power

46
46 Power Curves

47
47 PCB estimate the mean concentration with an estimated standard error (e.s.e.) precision of 0.1 mg kg -1. The variation of PCB in salmon flesh is 3.19 2. Therefore, how many samples would be required? Since the e.s.e. of the sample mean is s/ n, then one must solve for n, for example:

48
48 Sample size-too big Thus this degree of improvement in precision, can only be achieved by increasing the number of samples taken to approximately 1000. This may well be impractical; therefore the only solution may be to accept a lower precision.

49
Example: 60 Co activity in sediment of an estuary- rp.firth Suppose wanted to estimate the inventory of 60 Co in the sediments of an estuary whose boundaries have been clearly defined. We know that 60 Co is particle reactive and we have a map of sediment type in the estuary. How would we make use of this information?

50
Stratified sampling chosen

51
Example: tritium in a South Pacific atoll- rp.mururoa Suppose wanted to map the distribution of tritium inside and atoll (tritium in sea water). This will require us to collect water samples. How should we do this?

52
Transect sampling chosen

53
Examples to try try the Mururoa and Rosyth examples again and look at the map that is produced and compare it with the truth- try various sampling strategies Library(rpanel) rp.mururoa() rp.firth()
 rp.mururoa() rp.firth()")
54
Summary Spatial modelling is an important skill, since much environmental data are spatially registered the complexities include describing the spatial correlation structure and considering if there is a temporal component how this can be modelled.

Similar presentations


>")


