Download presentation
Presentation is loading. Please wait.

1
Measurements and Their Uncertainty 3.1

2
Using and Expressing Measurements
3.1 Using and Expressing Measurements Bell Work What are some examples from the “Real World” of when you would need to take scientific measurements?

3
Using and Expressing Measurements
3.1 Using and Expressing Measurements A measurement is a quantity that has both a number and a unit.

4
Using and Expressing Measurements
3.1 Using and Expressing Measurements scientific notation: a coefficient and 10 raised to a power. The number of stars in a galaxy is an example of an estimate that should be expressed in scientific notation. Why? Expressing very large numbers, such as the estimated number of stars in a galaxy, is easier if scientific notation is used.

5
Accuracy, Precision, and Error
3.1 Accuracy, Precision, and Error Accuracy and Precision Accuracy is a measure of how close a measurement comes to the actual or true value of whatever is measured. To evaluate the accuracy of a measurement, the measured value must be compared to the correct value.

6
To evaluate the precision of a measurement, you must compare the values of two or more repeated measurements. Precision is a measure of how close a series of measurements are to one another.

7
Accuracy, Precision, and Error
3.1 Accuracy, Precision, and Error Just because a measuring device works, you cannot assume it is accurate. The scale below has not been properly zeroed, so the reading obtained for the person’s weight is inaccurate. The scale below has not been properly zeroed, so the reading obtained for the person’s weight is inaccurate. There is a difference between the person’s correct weight and the measured value. Calculating What is the percent error of a measured value of 114 lb if the person’s actual weight is 107 lb?

8
Accuracy, Precision, and Error
3.1 Accuracy, Precision, and Error The distribution of darts illustrates the difference between accuracy and precision. a) Good accuracy and good precision: The darts are close to the bull’s-eye and to one another. b) Poor accuracy and good precision: The darts are far from the bull’s-eye but close to one another. c) Poor accuracy and poor precision: The darts are far from the bull’s-eye and from one another.
 Good accuracy and good precision: The darts are close to the bull’s-eye and to one another. b) Poor accuracy and good precision: The darts are far from the bull’s-eye but close to one another. c) Poor accuracy and poor precision: The darts are far from the bull’s-eye and from one another.")
9
Accuracy, Precision, and Error
3.1 Accuracy, Precision, and Error Determining Error The accepted value is the correct value based on reliable references. The experimental value is the value measured in the lab. The difference between the experimental value and the accepted value is called the error.

10
Accuracy, Precision, and Error
3.1 Accuracy, Precision, and Error The percent error is the absolute value of the error divided by the accepted value, multiplied by 100%. Expressing very large numbers, such as the estimated number of stars in a galaxy, is easier if scientific notation is used.

11
Accuracy, Precision, and Error
3.1 Accuracy, Precision, and Error

12
Sig Figs The significant figures in a measurement include all of the digits that are known, plus a last digit that is estimated.

13
Significant Figures in Measurements
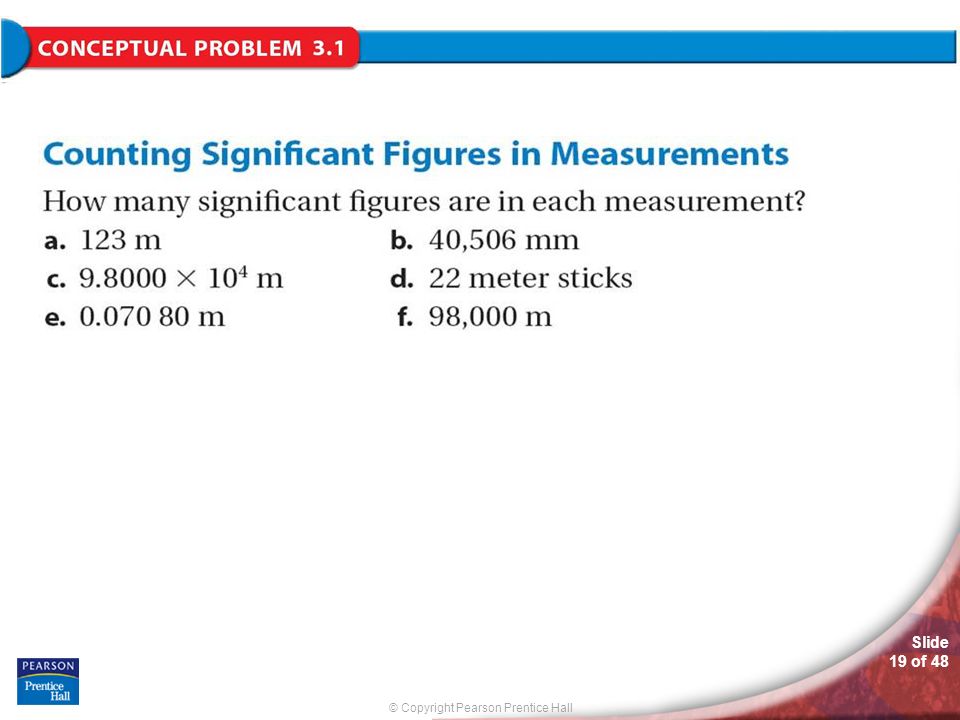
3.1 Significant Figures in Measurements Significant Figures in Measurements Why must measurements be reported to the correct number of significant figures?

14
Significant Figures in Measurements
3.1 Significant Figures in Measurements Example: Suppose you estimate a weight that is between 2.4 lb and 2.5 lb to be 2.46 lb. The first two digits (2 and 4) are known. The last digit (6) is an estimate and involves some uncertainty. All three digits convey useful information, however, and are called significant figures.
 are known. The last digit (6) is an estimate and involves some uncertainty. All three digits convey useful information, however, and are called significant figures.")
15
Significant Figures in Measurements
3.1 Significant Figures in Measurements

16
Significant Figures in Measurements
3.1 Significant Figures in Measurements

17
Significant Figures in Measurements
Animation 2 See how the precision of a calculated result depends on the sensitivity of the measuring instruments.

18
Significant Figures in Measurements
3.1 Significant Figures in Measurements Three differently calibrated meter sticks are used to measure the length of a board. a) A meter stick calibrated in a 1-m interval. b) A meter stick calibrated in 0.1-m intervals. c) A meter stick calibrated in 0.01-m intervals. Measuring How many significant figures are reported in each measurement?
 A meter stick calibrated in a 1-m interval. b) A meter stick calibrated in 0.1-m intervals. c) A meter stick calibrated in 0.01-m intervals. Measuring How many significant figures are reported in each measurement")
21
for Conceptual Problem 3.1
Problem Solving 3.2 Solve Problem 2 with the help of an interactive guided tutorial.

22
Significant Figures in Calculations
3.1 Significant Figures in Calculations Significant Figures in Calculations How does the precision of a calculated answer compare to the precision of the measurements used to obtain it?

23
Significant Figures in Calculations
3.1 Significant Figures in Calculations A calculated answer cannot be more precise than the least precise measurement from which it was calculated. The calculated value must be rounded to make it consistent with the measurements from which it was calculated.

24
Significant Figures in Calculations
3.1 Significant Figures in Calculations Rounding To round a number, you must first decide how many significant figures your answer should have. The answer depends on the given measurements and on the mathematical process used to arrive at the answer.

25
3.1

26
3.1

27
3.1

28
for Sample Problem 3.1 Problem Solving 3.3 Solve Problem 3 with the help of an interactive guided tutorial.

29
Significant Figures in Calculations
3.1 Significant Figures in Calculations Addition and Subtraction The answer to an addition or subtraction calculation should be rounded to the same number of decimal places (not digits) as the measurement with the least number of decimal places.
 as the measurement with the least number of decimal places.")
30
3.2

31
3.2

32
3.2

33
for Sample Problem 3.2 Problem Solving 3.6 Solve Problem 6 with the help of an interactive guided tutorial.

34
Significant Figures in Calculations
3.1 Significant Figures in Calculations Multiplication and Division In calculations involving multiplication and division, you need to round the answer to the same number of significant figures as the measurement with the least number of significant figures.

35
3.3

36
3.3

37
for Sample Problem 3.3 Problem Solving 3.8 Solve Problem 8 with the help of an interactive guided tutorial.

38
Section Assessment 3.1.

39
3.1 Section Quiz 1. In which of the following expressions is the number on the left NOT equal to the number on the right? 10–8 = 4.56 10–11 454 10–8 = 4.54 10–6 842.6 104 = 106 106 = 4.52 109

40
3.1 Section Quiz 2. Which set of measurements of a 2.00-g standard is the most precise? 2.00 g, 2.01 g, 1.98 g 2.10 g, 2.00 g, 2.20 g 2.02 g, 2.03 g, 2.04 g 1.50 g, 2.00 g, 2.50 g

41
3.1 Section Quiz 3. A student reports the volume of a liquid as L. How many significant figures are in this measurement? 2 3 4 5

42
END OF SHOW

Similar presentations