Download presentation
Presentation is loading. Please wait.

1
Safety: Dont Become a Statistic March 29 th, 2006 Sara Saulcy, Senior Economist Wyoming Department of Employment, Research & Planning

2
Topics Comparison of Research & Planning (R&P) and OSHA functions. How R&P and OSHA use one anothers data. How R&P obtains injury and fatality data. Most recent statistics on occupational injuries and fatalities in the U.S. and Wyoming. Focus on traffic accidents.

3
R&Ps and OSHAs Roles in Occupational Safety OSHA and R&P are both housed in the Wyoming Department of Employment. R&P is part of the Unemployment Tax Division. OSHA is part of the Workers Safety & Compensation Division. OSHA has a direct role in worker safety and health while R&Ps role is indirect.

4
OSHA Oversees the implementation and enforcement of worker safety regulations. Helps employers with accident prevention strategies. Does not investigate work-related traffic deaths. Traffic accidents are the leading cause of occupational fatalities in both Wyoming and the U.S. R&P Collects and analyzes health and safety data. Survey of Occupational Injuries and Illnesses (SOII) Census of Fatal Occupational Injuries (CFOI) By Federal law, data that allows individual firms or workers to be recognized cannot be released. R&Ps and OSHAs Roles in Occupational Safety Continued
 Census of Fatal Occupational Injuries (CFOI) By Federal law, data that allows individual firms or workers to be recognized cannot be released. R&Ps and OSHAs Roles in Occupational Safety Continued.")
5
OSHA uses SOII and CFOI data to track accident and illness trends. R&P uses OSHA accident reports to confirm work-related fatalities for CFOI. How R&P and OSHA Use One Anothers Data

6
Injuries and Illnesses Defined Injuries are acute (short term). A broken arm from a fall down the stairs A concussion from being hit on the head by a hammer Illnesses are chronic (long term). Carpal tunnel syndrome Black lung disease
. Carpal tunnel syndrome Black lung disease.")
7
Obtaining Occupational Injury & Fatality Data Nonfatal injury and illness data are collected via the SOII. If selected to participate in the SOII, your firm will first receive a notice of requirement to participate in December prior to the year you are you required to participate. Over the course of the year, your firm keeps track of work-related injuries or illnesses that occur on the OSHA 300 form included in the Notification booklet. The SOII is the only mandatory survey R&P conducts.

8
Obtaining Occupational Injury & Fatality Data Continued In January following the year your firm tracked injuries/illnesses, your firm will receive a 2 nd booklet. Record any injuries or illnesses that occur in the booklet, along with some employment information, then mail it back. R&P cant accept the 300 form. Even if your firm did not have any injuries or illnesses, we need your information.

9
Report only those injuries or illnesses that required a doctors treatment. Set bones Prescriptions Stitches The following are not considered doctors treatment, even if performed by a doctor. Diagnostic tests X-rays blood tests First aid Band aids Flushing of eyes with water Pulling splinters or other objects with tweezers Obtaining Occupational Injury & Fatality Data Continued

10
Using the information that firms provide, estimates of nonfatal injuries and illnesses are developed at the state and national levels. Data are used for a variety of purposes by agencies such as OSHA. Occupational Injury Data After the Survey

11
Collecting Occupational Fatality Data Administrative and public records are the main data sources Death certificates OSHA reports News media reports Only rarely are employers ever directly contacted about work-related deaths. CFOI data are used for purposes similar to SOII data.

12
Nonfatal Injuries & Illnesses – U.S.

13
Nonfatal Injuries & Illnesses – U.S. Continued

14
Injuries and illnesses per 100 full-time workers

15
Nonfatal Injuries & Illnesses – Wyoming

16
Nonfatal Injuries & Illnesses – Wyoming Continued

17
Nonfatal Injuries & Illnesses U.S./ Wyoming Comparison Agriculture, Forestry, Fishing & Hunting had the highest incident rate in Wyoming. Transportation & Warehousing had the highest rate nationwide. Financial Activities had the lowest rate for both the U.S. and Wyoming.

18
Fatal Workplace Injuries – U.S.

19
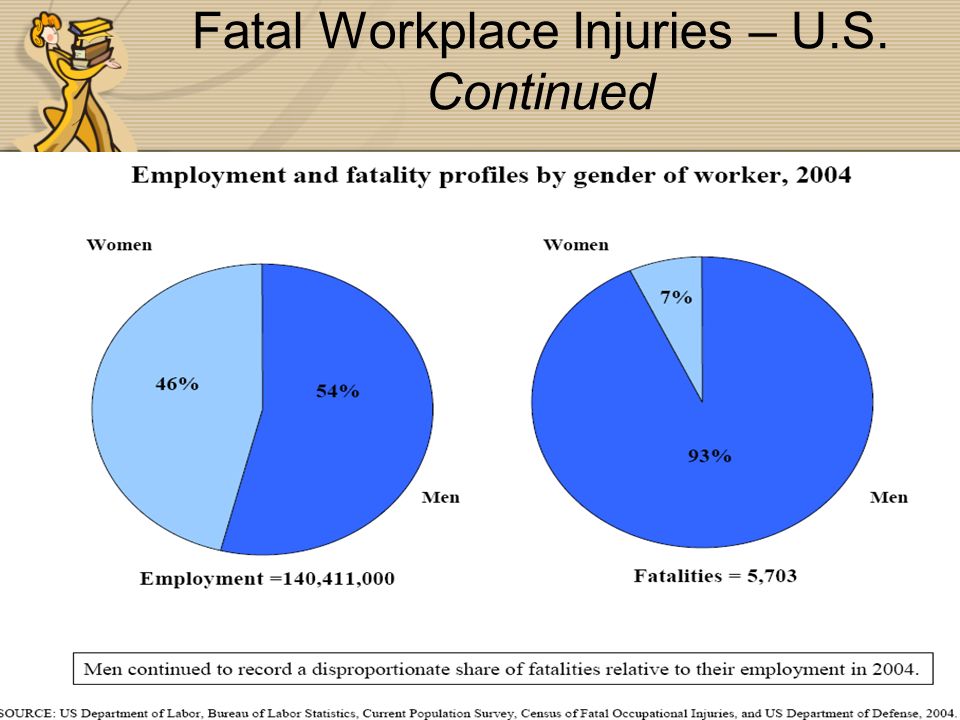
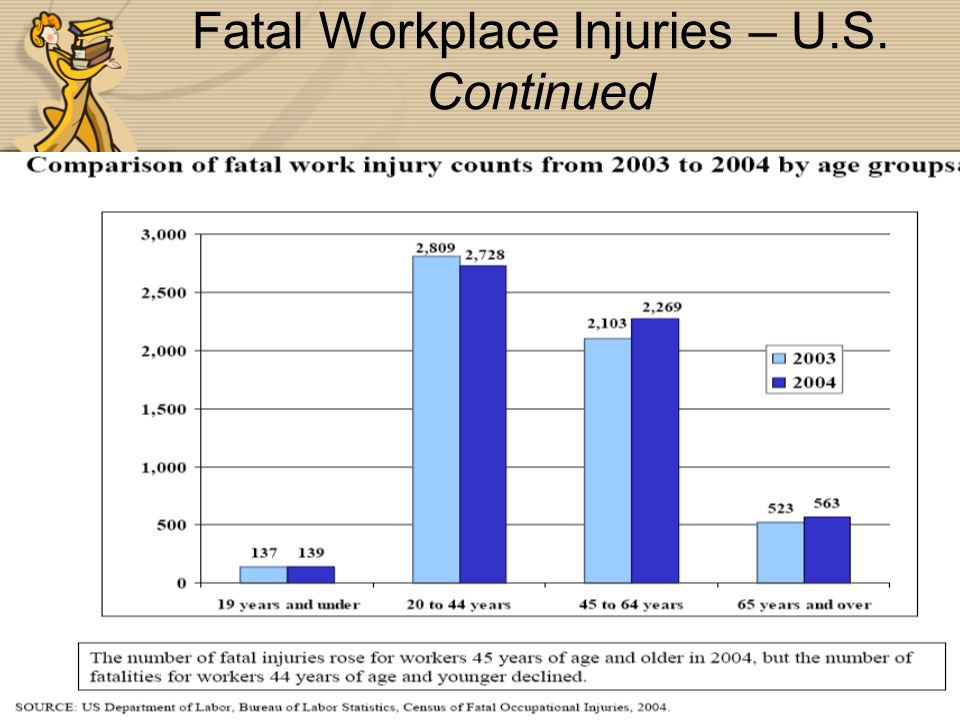
Fatal Workplace Injuries – U.S. Continued

24
Fatal Workplace Injuries Wyoming

25
Fatal Workplace Injuries Wyoming Continued

29
Fatal Workplace Injuries U.S./Wyoming Comparison The high numbers of mens deaths in Wyoming and the U.S. is at least partly a result of the occupations and industries in which they work. Wyoming followed the U.S. pattern of increases in deaths over the past two years. The Construction industry lead the U.S. in deaths, while Trade, Transportation, & Utilities experienced the most in Wyoming. Traffic accidents were the leading cause of work-related fatal accidents for both Wyoming and the U.S.

30
Rural vs. Urban U.S. Highway Fatalities 1994-2003

31
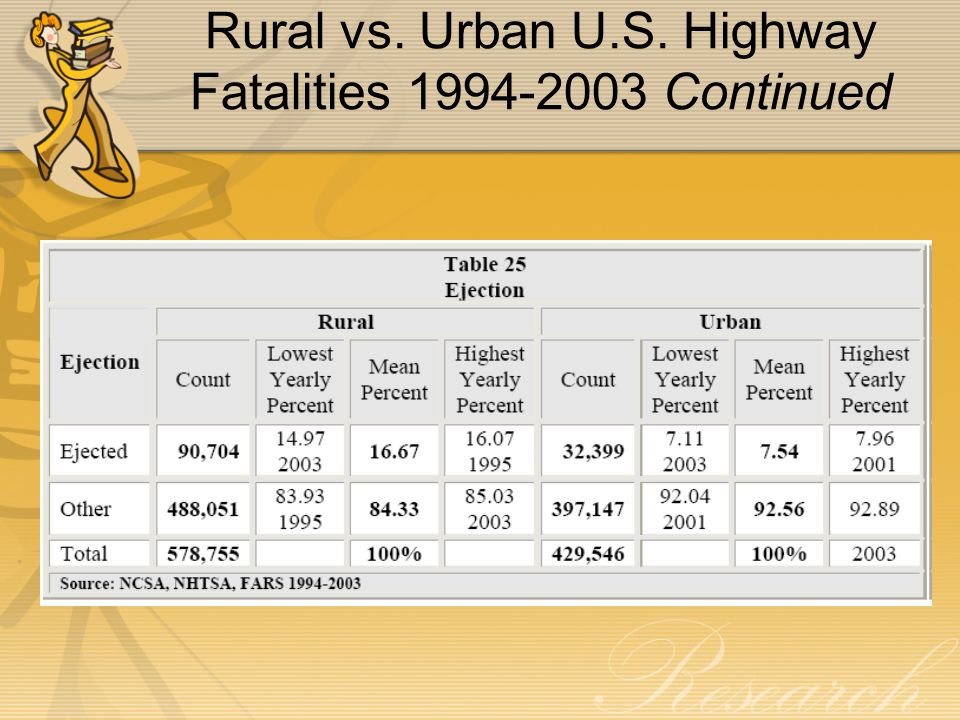
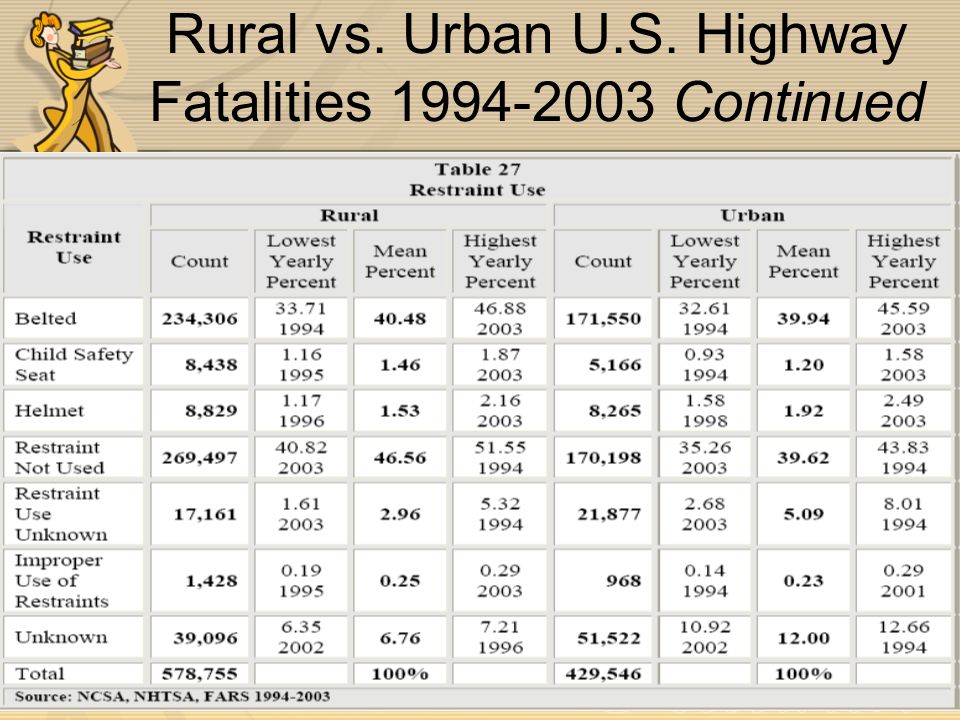
Rural vs. Urban U.S. Highway Fatalities 1994-2003 Continued

35
U.S. Highway Fatalities

36
Wyoming Highway Fatalities 2004

37
Wyoming Highway Fatalities Seat Belt Use Lags in Wyoming Casper Star-Tribune March 21, 2006 Cheyenne – Wyoming lags behind the nation in seat belt use the Wyoming Department of Transportation announced Monday. Only 56 percent of Wyoming drivers are using seat belts. On a national level, seat belt use is at an all-time high of 82 percent. Nearly 70 percent of the people who died on Wyoming roads in 2005 were not wearing seat belts. The Wyoming Highway Patrol and other law enforcement agencies will work overtime this week to crack down on people who fail to use their seatbelts.

38
Wyoming Work-Related Highway Fatalities

39
What Traffic Accidents Mean for Employers Bottom Line Crashes cost YOUR BUSINESS money. Estimated annual total cost to Wyoming employers of on- and off-the-job crashes from 1998-2000 $73 million $310 per employee Nationwide, crashes cost employers an estimated $41.5 billion per year from 1998-2000.

40
Whats an Employer to Do? The number one way to avoid becoming a CFOI statistic Wear your seatbelt

41
Whats an Employer to Do? Dont wait for an accident to happen before you talk to your employees about safe travel. REMIND THEM TO BUCKLE UP. Slow down on slick roads. Avoid driving distractions. Help your workers overcome the it will never happen to me attitude. Employer traffic safety resources on the Internet.

42
Lets be safe out there.

Similar presentations


 Lindsey Holderman & Miranda Moore.>")

>")


