Download presentation
Presentation is loading. Please wait.

1
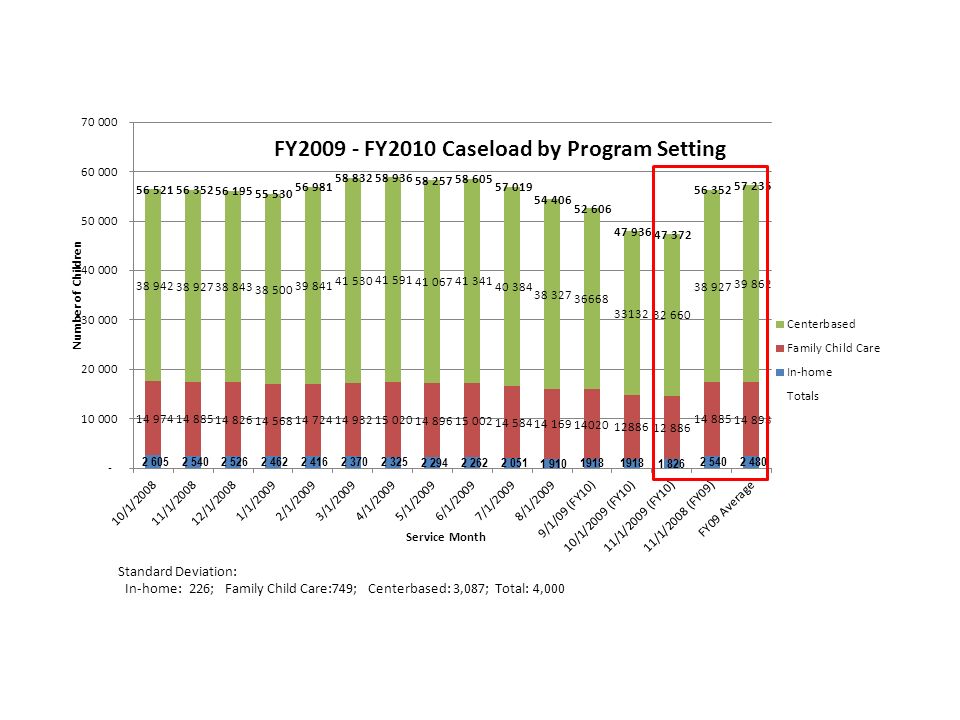
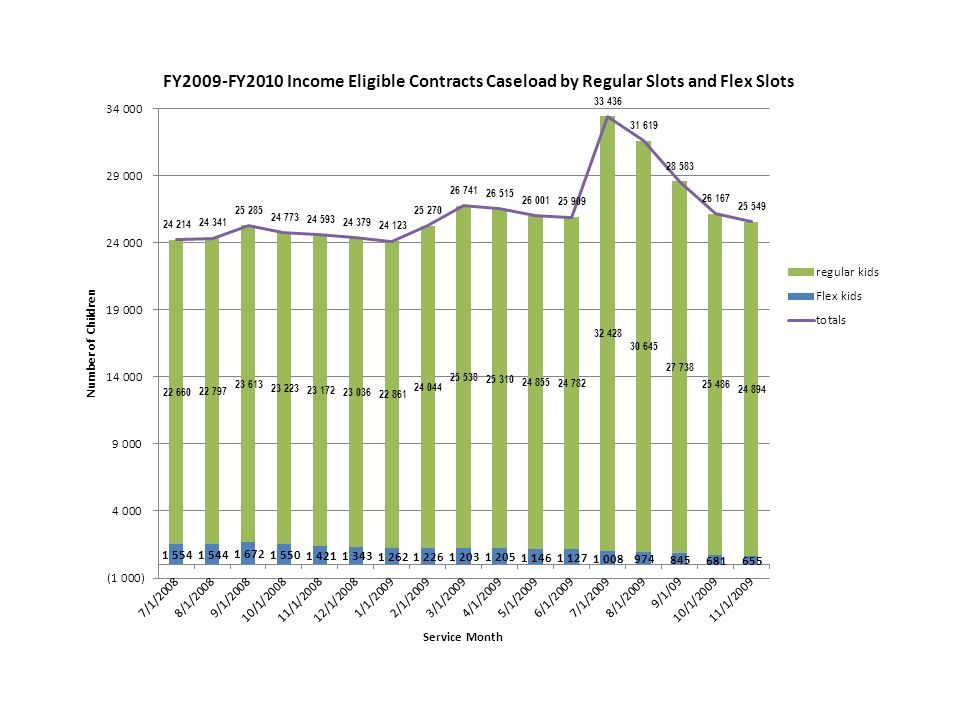
Data Included: 2009-2010 Caseload by Age Group 2009-2010 Caseload by Program Setting 2009-2010 Caseload by Child Care Account 2009-2010 Caseload IE Contracts Caseload by Regular and Flex Pool Slots 2009-2010 IE Voucher Attrition Supportive FY10 Actual/Projected Cost DTA Actual/Projected FY10 Spending Income Eligible FY10 Actual/Projected Cost

7
Fiscal Year 2010 Supportive Caseload Projected Cost 7 Current deficiency stand over $1.1M. (Amount in Thousands)
.")
8
Fiscal Year 2010 DTA Caseload Projected Cost (Amount in Thousands) FY10 Approp: $116.2M
 FY10 Approp: $116.2M")
9
Fiscal Year 2010 Income Eligible Caseload Projected Cost 9 (Amount in Thousands)
")
Similar presentations


 Blue represents actual amount billed Current projections indicate.>")


 American Recovery and Reinvestment Act (ARRA) Board of Early Education and Care September 15, 2009.>")


