Download presentation
Presentation is loading. Please wait.

1
Response To Intervention On the Ground: Diagnosing the Learning Enabled EED Winter Education Conference Informing Instruction: Improving Achievement W. David Tilly III Heartland Area Education Agency 11 Johnston, Iowa January 18, 2007 Correspondence about this presentation should be directed to David Tilly, Heartland AEA 11, 6500 Corporate Dr., Johnston, IA 50131. Email is davidtilly@mchsi.com, (515) 321-9554.
")
2
Who am I?

3
Take Home Points RTI is about success for all kids RTI can apply to all grades (k-12) RTI is about bringing what works into schools and supporting it
 RTI is about bringing what works into schools and supporting it")
4
Overview of RTI Objectives Communicate major components of a problem solving, school wide model Provide an integrative picture of the STRUCTURE Provide a picture of the PROCESS of getting it all in place Begin to consider application in your setting

5
PS, RTI, School Wide Model What it isWhat it is not Represents a way of: Using data to examine the system in relation to most important results. A panacea Structuring thinking so that we dont miss anything A curriculum, an intervention, one theoretical orientation Identifying strategies with a high probability of improving student performance and knowing if they work One size fits all Keeping our attention focused on the most important things Hoops to jump through Common sense into practice (cf. Fullan) Easier than what came before
 Easier than what came before.")
6
Quote We have witnessed over the last 30 years numerous attempts at planned educational change. The benefits have not nearly equaled the costs, and all too often, the situation has seemed to worsen. We have, however, gained clearer and clearer insights over this period about the dos and donts of bringing about change….One of the most promising features of this new knowledge about change is that successful examples of innovation are based on what might be most accurately labeled organized common sense. (Fullan, 1991, p. xi-xii) Fullan, M. G. (1991). The new meaning of educational change. New York, NY : Teachers College Press.
 Fullan, M. G. (1991). The new meaning of educational change. New York, NY : Teachers College Press..")
7
Principles Underlying RTI (Much of this is not new) Intervene early. Use a multi-tiered model of service delivery. Use a problem-solving method (PSM) to make decisions at each of the three tiers. Use research-based, scientifically validated interventions/instruction to the extent available. Monitor student progress to inform instruction. Use data to make decisions. Use assessment for 3 different purposes.
 to make decisions at each of the three tiers. Use research-based, scientifically validated interventions/instruction to the extent available. Monitor student progress to inform instruction. Use data to make decisions. Use assessment for 3 different purposes..")
8
Major Conceptual Shift (You Gotta Get This to Understand RTI) Old System was based on a Deficit Model of assessment and intervention An RTI System is based on a Risk Model They share some features They are different in significant ways
 Old System was based on a Deficit Model of assessment and intervention An RTI System is based on a Risk Model They share some features They are different in significant ways")
9
Deficit Model Assumption: In every distribution of kids, some of them have specific deficits and therefore will fail to learn. Historical Practice: The job of the assessor is to assess students to identify their deficits so we can provide services. We use the best tools available, matched to students presumed deficits. We use these data to help identify what and how to teach. Level below which we infer possible deficits Achievement Low High

10
Risk Model Assumption: All kids will learn basic skills to a basic level of proficiency. Some kids are at risk of not learning them. Practice: The job of the assessor is to to identify students who are at risk of not learning basic skills to a minimum standard of proficiency. Also, the assessor identifies patterns of performance on instructionally relevant subskills. We use these data to figure what And how to teach these students. Minimum Proficiency Achievement Low High

11
Our Job To Go From HereTo Here

12
Acknowledgements In all the stuff I am going to present, I am indebted to the thinking of LOTS OF PEOPLE. Drs. Joe Witt and Amanda VanDerHeyden, from the STEEP project at Louisiana State University for some of the logic in the Universal Screening Illustration. Dr. George Batsche from University of South Florida as well as Dr. Joe Kovaleski and Dr. Ed Shaprio from PA contributed both excellent thinking and on the ground experience to some of the case study logic. I am also indebted to the work of Drs. Ed Kameenui, Deb Simmons, Roland Good, George Sugai and Rob Horner from the University of Oregon. Lots of the NICHD researchers, e.g., Drs. Jack Fletcher, Sharon Vaughn, Sally and Bennett Shaywitz, Joe Torgeson, Reid Lyon, Debbie Speece, among many others have laid the foundation for making much of this possible. Also, Dr. Martin Ikeda from Heartland AEA, in Johnston IA assisted in designing and implementing some of the data displays. Additionally, Sharon Kurns, Randy Allison, Rob Brookhart and the Heartland crew significantly contributed to many parts of this presentation.

13
Academic SystemsBehavioral Systems 5-10% 10-15% Intensive, Individual Interventions Individual Students Assessment-based High Intensity Of longer duration Intensive, Individual Interventions Individual Students Assessment-based Intense, durable procedures Targeted Group Interventions Some students (at-risk) High efficiency Rapid response Targeted Group Interventions Some students (at-risk) High efficiency Rapid response 75-85% Universal Interventions All students Preventive, proactive Universal Interventions All settings, all students Preventive, proactive A Smart System Structure Enter a School-Wide Systems for Student Success
 High efficiency Rapid response Targeted Group Interventions Some students (at-risk) High efficiency Rapid response 75-85% Universal Interventions All students Preventive, proactive Universal Interventions All settings, all students Preventive, proactive A Smart System Structure Enter a School-Wide Systems for Student Success")
14
How Does it Fit Together? Group-Level Diagnostic Std. Treatment Protocol Addl. Diagnostic Assessment Instruction Results Monitoring Individual Diagnostic Individualized Intensive weekly All Students at a grade level Fall Winter Spring Universal Screening None Continue With Core Instruction Grades Classroom Assessments Yearly ITBS/ITED Group Diagnostic Small Group Differen- tiated By Skill 2 times/month Step 1 Step 2Step 3Step 4 Supplemental 1-5% 5-10% 80-90% Core Intensive

15
How Does it Fit Together? Uniform Standard Treatment Protocol Addl. Diagnostic Assessment Instruction Results Monitoring Individual Diagnostic Individualized Intensive 2x weekly All Students at a grade level Fall Winter Spring Universal Screening None Continue With Core Instruction Grades Classroom Assessments Yearly ITBS/ITED Step 1 Step 2Step 3Step 4 Supplemental 1-5% 5-10% 80-90% Core Intensive 2-4 times/month None Small Group, all less than proficient students get the same, balanced, research-validated instruction

16
Big Ideas of RtI: For RtI to Be Effective We Must Use an instructionally relevant and efficient resource deployment system Use scientifically research-based practice to extent available Match instruction to individual student needs Make sure the instruction is sufficiently explicit and sufficiently intense Monitor implementation fidelity Monitor student response and change instruction as necessary

17
Large Group

18
Academic SystemsBehavioral Systems 5-10% 10-15% Intensive, Individual Interventions Individual Students Assessment-based High Intensity Of longer duration Intensive, Individual Interventions Individual Students Assessment-based Intense, durable procedures Targeted Group Interventions Some students (at-risk) High efficiency Rapid response Targeted Group Interventions Some students (at-risk) High efficiency Rapid response 75-85% Universal Interventions All students Preventive, proactive Universal Interventions All settings, all students Preventive, proactive Focus on CORE CURRICULUM Enter a School-Wide Systems for Student Success
 High efficiency Rapid response Targeted Group Interventions Some students (at-risk) High efficiency Rapid response 75-85% Universal Interventions All students Preventive, proactive Universal Interventions All settings, all students Preventive, proactive Focus on CORE CURRICULUM Enter a School-Wide Systems for Student Success")
19
Large Group Illustration Is our initial instruction meeting the needs of enough students? Historically, there hasnt been a target on acceptable success rates. Some kids were successful Some kids werent Kids who were not successful got different programming through different programs Screening was haphazard

20
Large Group Illustration We have a new assumption to start from: All kids successful A rate of 80% has been suggested by many researchers and policy makers nationally, as the rate needed for Initial Instruction The number of kids in strategic or intensive programs can vary based on available resources, 20% seems reasonable

21
Large Group Illustration If we are going to become more systematic, we need to become more data-based One way to do this is Universal Screening We do this already in vision and hearing Until recent years, we havent had the technologies to do this in academics and social-behavioral areas We have the technologies to do it in other areas Reading Math Social Behavior Great advantages for teachers, for students and for the system

22
What is a Universal Screening? Given to everyone Critical Skills Brief Repeatable Cheap and easy to administer and score Tells us who needs more assessment

23
Activity #1 With a colleague sitting near you, discuss the following question. If we were able to do universal screening across the grade levels in Academics and Social/Emotional development, what advantages would there be for: Teachers? Parents? Kids?

24
The Illustration Well Look At Elementary School About 100 kids per grade level About 20% FRPL Well look at the area of Mathematics Some problems on accountability assessments in computation Question, is initial instruction across the grade levels as effective as we want it to be in the areas of computation?

25
Screening indicates math problem grades 3 to 5 Third Grade Math Addition and Subtraction About 81% Meeting minimum proficiency

26
Screening indicates math problem grades 3 to 5 Fourth Grade Math About 32% Meeting Minimum Proficiency

27
Screening indicates math problem grades 3-5 Fifth Grade Math About 42% Meeting Minimum Proficiency

28
Houston, We Have a Problem An opportunity to engage a team of persons with expertise from across the system Data analyst Curriculum Specialists Teachers Administrators Parents

29
Activity #2 Think for a minute, who are the persons in your school/district who can help with RTI in each of these roles? Data analyst (specify assmt, help collect, summarize data) Curriculum Specialists (folks with broad and deep knowledge of effective practice and can train it) Teachers – folks with broad and deep knowledge of district Standards and Benchmarks, Curriculum/Instruction and of the students Administrators – who can help lead and support Parents – who will support the system that you put in place
 Curriculum Specialists (folks with broad and deep knowledge of effective practice and can train it) Teachers – folks with broad and deep knowledge of district Standards and Benchmarks, Curriculum/Instruction and of the students Administrators – who can help lead and support Parents – who will support the system that you put in place.")
30
Large Group Cross grade group focused on mathematics Conducted a diagnostic large group assessment (why is the problem happening?) Curriculum – examine the extent to which computation was included across grades 1-5 Instruction – Collect data on how computation was instructed The environment – examine expectations for computational proficiency Learner characteristics – Conduct systematic error analysis and error categorization on student performance data from the screening and classroom data
 Curriculum – examine the extent to which computation was included across grades 1-5 Instruction – Collect data on how computation was instructed The environment – examine expectations for computational proficiency Learner characteristics – Conduct systematic error analysis and error categorization on student performance data from the screening and classroom data")
31
Large Group Illustration Causal HypothesisPrediction Our current curriculum emphasizes problem solving, very little emphasis is placed on computation. It is taught infrequently If we add a computation component to our curriculum, more students will meet minimum proficiency standards Most of our teacher allocate a majority of their math instructional time teaching problem solving (following the curriculum guides) If we allocate 20 percent of our mathematics instructional time to teaching computation in each grade 1-5, more students will meet minimum proficiency standards Some of our new teachers do not have experience systematically teaching computation If we provide systematic professional development, guided practice and coaching on teaching computation to any teacher who wants it, more students will meet minimum proficiency standards
 If we allocate 20 percent of our mathematics instructional time to teaching computation in each grade 1-5, more students will meet minimum proficiency standards Some of our new teachers do not have experience systematically teaching computation If we provide systematic professional development, guided practice and coaching on teaching computation to any teacher who wants it, more students will meet minimum proficiency standards.")
32
Growth Obtained (one way to look at your data) Goal Average Scores for Grade Level
 Goal Average Scores for Grade Level")
33
Intervention Effectiveness: Another way to look at your data One group of kids at a time (these are Title 1 Kids) Still some kids not getting it!
 Still some kids not getting it!")
34
Re-screening Indicates No Systemic Problem Third Grade *Note: One classrooms data are missing from this analysis About 84% meeting minimum performance About 81% before

35
Re-screening Indicates No Systemic Problem Fourth Grade About 94% meeting minimum performance Compared to 32% before. Multiplication and Division Mixed

36
Re-screening Indicates No Systemic Problem Fifth Grade About 70% meeting minimum performance Compared to 42% before. Multiplication and Division Mixed

37
What do you need for universal screening? Data on all students in the district in the areas you are interested in screening An efficient way to administer and score tests Tests linked to standards and benchmarks Defined Criteria of Success Best case: do it two or three times per year

38
Small Group

39
Grade 11 ITED Proficiency 0 10 20 30 40 50 60 70 80 90 100 Program TAG SpEd Migrant Gen Ed ELL Student ITED NPR Total Reading Not Proficient What Questions Would You Have? Proficient

40
Activity #3 At your table consider You are a High School Teacher These are your schools accountability Reading Comprehension data. What questions would you have about this chart? What questions would you have at a program level in your school? How would you go about answering them?

41
Academic SystemsBehavioral Systems 5-10% 10-15% Intensive, Individual Interventions Individual Students Assessment-based High Intensity Of longer duration Intensive, Individual Interventions Individual Students Assessment-based Intense, durable procedures Targeted Group Interventions Some students (at-risk) High efficiency Rapid response Targeted Group Interventions Some students (at-risk) High efficiency Rapid response 75-85% Universal Interventions All students Preventive, proactive Universal Interventions All settings, all students Preventive, proactive Focus on SUPPLEMENTAL INSTRUCTION Enter a School-Wide Systems for Student Success
 High efficiency Rapid response Targeted Group Interventions Some students (at-risk) High efficiency Rapid response 75-85% Universal Interventions All students Preventive, proactive Universal Interventions All settings, all students Preventive, proactive Focus on SUPPLEMENTAL INSTRUCTION Enter a School-Wide Systems for Student Success")
42
Small Group – Supplemental Instruction Two sets of options When initial instruction is not sufficient to support the students ongoing proficiency in a content area Small group interventions matched to individual student needs Group-level standard treatment protocols (scientifically-based interventions)
")
43
Option 1: Small Group Interventions We have noted over the last 10 years or so, that there are strong patterns to the types of referrals we get. Often they are similar by teacher or by school We have begun encouraging our professionals to ask if there are pockets of kids with similar problems when they begin problem solving cases.

44
Option 1: Small Group Interventions Matched to Individualized Need We need to assess reading critical components Additional Assessment Oral Reading Fluency Accuracy Comprehension - Maze and Retell Add ITP Vocabulary

45
For Less Than Proficient Kids, Figure Out What They Need Critical Components of Reading Additional Diagnostic Assessments

46
Kids with Different Needs Often have DIFFERENT NEEDS!!!!

47
Some General Observations About Tier 2 Interventions Need to differentiate for groups We need to group students with like needs together Our assessment logic should progress from the highest likelihood reasons that kids have reading problems to less likely reasons We must prioritize our instruction

48
Option 1: Small Group Interventions It is only within the past 3 or 4 years that we have begun looking systemically at how we can unify our small group intervention programs and processes beyond early literacy Many issues Funding Silos Political Issues Logistics Polymorphous Philosophies

49
Option 1: Our Successes We have been most successful when we can plan systemically within a building/district (e.g., HELP) Also, our most successful districts have gotten very proactive, systemic and prescriptive about their school wide programs An example program schematic from a middle- sized Heartland district
 Also, our most successful districts have gotten very proactive, systemic and prescriptive about their school wide programs An example program schematic from a middle- sized Heartland district")
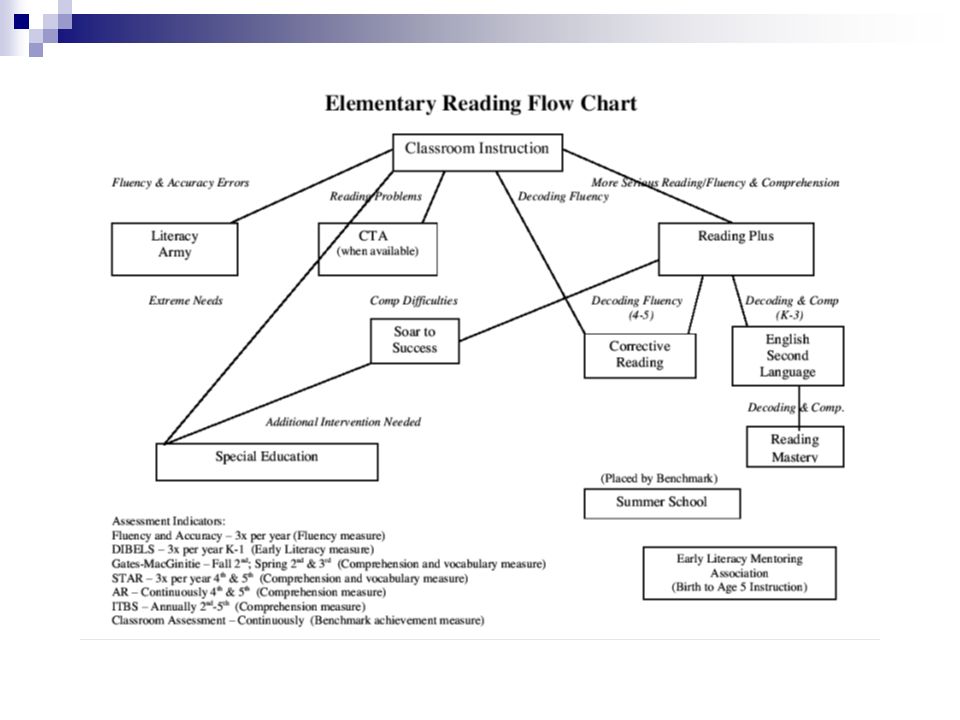
51
Option 1: Set of Standard Interventions Matched to Student Need Comprehension Collaborative Strategic Reading (Vaughn) Reading in the Content Area (Kinsella) Fluency Six Minute Solution (Hiebert) Read Naturally (Imhott) Decoding Rewards (Archer) Phonics for Reading (Archer) Corrective Reading (SRA) Warning: This is just a sample from one of our middle schools. Your set may be very different!

52
Option 1: Monitor Student Performance For this group, we need to monitor progress probably weekly or once every couple weeks We need to use our data to determine the effectiveness of our instruction We need to change instructional programs that are not working

53
Tier 2: Gear Shift

54
Option 2: Standard Treatment Protocol Interventions Can be put in place for all kids who do not demonstrate proficiency in a skill area Individual/group diagnostics are limited if they occur at all at this point in time - $$$ saved These interventions will work for some group of less than proficient learners

55
Option 2: Standard Treatment Protocol Interventions Examples of Standard Treatment Protocols can be found in the research of Sharon Vaughn, Frank Vellutino, Barbara Foorman, Debbie Speece, Rolanda OConnor, Joe Torgeson among others These are treatment protocols identified by researchers as being scientifically based and effective They tend to be very structured They tend to use explicit, systematic instruction They tend to be multi-skill focused They tend to be intensive They tend to be multiple weeks long Progress is monitored and instructional decisions are made Most of them use scientifically validated measurement models (E.g. DIBELS, Curriculum-Based Measurement)
.")
56
PUNCH LINE: We Moved From Diagnosing and Serving Disabilities to Serving the Learning Enabled Requires a shift in focus from measuring outputs to measuring inputs Requires diagnosing the conditions under which the learners learning is enabled, assessment for intervention planning.

57
What will we do when students dont learn? Established RTI Team Each grade level structured time for supplemental and intensive instruction Determined personnel to provide instruction Teachers from all areas supporting content teachers Selected set of standard treatments Developed exit criteria

58
Intensive Instruction for Individuals

59
Individual Intensive Intervention/Instruction Roughly 5-10% of Our Kids We have nearly 15 years experience with this It works for all kinds of problems In our system, intensive intervention can occur in general education, special education or both Our special education system now operates substantially on these principles and practices

60
Academic SystemsBehavioral Systems 5-10% 10-15% Intensive, Individual Interventions Individual Students Assessment-based High Intensity Of longer duration Intensive, Individual Interventions Individual Students Assessment-based Intense, durable procedures Targeted Group Interventions Some students (at-risk) High efficiency Rapid response Targeted Group Interventions Some students (at-risk) High efficiency Rapid response 75-85% Universal Interventions All students Preventive, proactive Universal Interventions All settings, all students Preventive, proactive Focus on INTENSIVE INTERVENTIONS Enter a School-Wide Systems for Student Success
 High efficiency Rapid response Targeted Group Interventions Some students (at-risk) High efficiency Rapid response 75-85% Universal Interventions All students Preventive, proactive Universal Interventions All settings, all students Preventive, proactive Focus on INTENSIVE INTERVENTIONS Enter a School-Wide Systems for Student Success")
61
The Problem Solving Process Implement Plan (Treatment Integrity) Carry out the intervention Evaluate (Progress Monitoring Assessment) Did our plan work? Define the Problem (Screening and Diagnostic Assessments) What is the problem and why is it happening? Develop a Plan (Goal Setting and Planning) What are we going to do ?
 What is the problem and why is it happening. Develop a Plan (Goal Setting and Planning) What are we going to do .")
62
Lets Look at a Case

63
-Implement according to written plan -Ongoing systematic data collection -Follow-up as needed Evaluate Develop a Plan - Generate possible solutions -Evaluate solutions -Select a solution -Collect baseline data -Set a goal -Write action plan -Select measurement strategy -Develop plan to evaluate effectiveness Implement Plan Consultation with Extended Problem Solving Team Define the Problem -Identify concern -Define behavior of concern -Problem validation -Data analyzed to determine effectiveness -Success determined by rate of progress & size of discrepancy -Recycle or determine need to consider entitlement for special education -Problem analysis -Functional assessment -Write problem statement Parent Teacher BAT AEA Start Here

64
Illustration: Carlos Second grader, Winter Referred identified in universal screening as at risk This is an example of a screening assessment Other classroom data were available to validate the problem 5 90th percentile 75th percentile 50th percentile 25th percentile 10th percentile Carlos Score 100 90 80 70 60 50 40 30 20 10 120 110 Oral Reading Fluency Carlos Performance Compared to Peers

65
-Implement according to written plan -Ongoing systematic data collection -Follow-up as needed Evaluate Develop a Plan - Generate possible solutions -Evaluate solutions -Select a solution -Collect baseline data -Set a goal -Write action plan -Select measurement strategy -Develop plan to evaluate effectiveness Implement Plan Consultation with Extended Problem Solving Team Define the Problem -Identify concern -Define behavior of concern -Problem validation -Data analyzed to determine effectiveness -Success determined by rate of progress & size of discrepancy -Recycle or determine need to consider entitlement for special education -Problem analysis -Functional assessment -Write problem statement Parent Teacher BAT AEA Next Here

66
Problem Analysis (Summary) Phonics (ORF is circa 10 words per minute in second grade passages) Decoding is very labored, slow, halted and inaccurate (fluency and accuracy) A majority of his correct words are high frequency sight words There are many letter-sound correspondences and letter combinations (digraphs and vowel teams) Carlos consistently struggles with (phonics) Carlos' phonemic awareness skills have some critical deficits Carlos is using a number of partial strategies to attack unfamiliar, phonetically regular words Carlos' oral language vocabulary is significantly limited compared to typical peers (vocabulary) All of which make very difficult for Carlos to comprehend what he reads (comprehension) Task-related behavior – Carlos has a many topographies of escape behavior. He whines, wiggles, asks for breaks and attempts to redirect his teacher into conversations unrelated to the lesson.

67
-Implement according to written plan -Ongoing systematic data collection -Follow-up as needed Evaluate Develop a Plan - Generate possible solutions -Evaluate solutions -Select a solution -Collect baseline data -Set a goal -Write action plan -Select measurement strategy -Develop plan to evaluate effectiveness Implement Plan Consultation with Extended Problem Solving Team Define the Problem -Identify concern -Define behavior of concern -Problem validation -Data analyzed to determine effectiveness -Success determined by rate of progress & size of discrepancy -Recycle or determine need to consider entitlement for special education -Problem analysis -Functional assessment -Write problem statement Parent Teacher BAT AEA Next Here

68
Carlos Initial Problem Analysis Causal HypothesisPrediction Phonemic segmentation fluency is around 28 phonemes per minute which hinders Carlos ability to read fluently and comprehend what he reads If we teach Carlos to segment words, this preskill will help him become a better reader Carlos has not been taught high probability word attack skills but has been taught partial strategies, which cause him to be an inaccurate reader If we teach Carlos effective, generalizable word attack strategies (phonics), his reading will become more accurate Carlos has not read enough to become a fluent, accurate reader with comprehension (miles on his tongue) If we provide Carlos with additional reading instruction and opportunities to read, his overall reading skills will improve Carlos' task related behaviors have been successful in allowing him to escape sustained reading. If we provide incentives for Carlos' efforts in reading and do not let him escape the reading tasks by squirreling, he will be able to sustain his reading for longer periods of time.

69
Benchmark is Top of Box Some Risk is inside the box At Risk is Below the box

70
Setting Up a Progress Monitoring Chart 100 90 80 70 60 50 40 30 20 10 Student Improvement is Job #1 Goal Area Name Goal Statement Expected Level of Performance #1 #2 #3 #4 Service Providers Parent Participation Baseline Carlos East ElementarySouth IowaVanderburgh Reading Parent will provide extra oral reading time at home. They would like graph sent home biweekly. District School Year Teacher M M M M M M M M M M M M M M M M M M M M M M M M M M M M M Nov Dec Jan Feb Mar Apr May Jun

71
Data-Based Determination of Expectations: Carlos Benchmark Level:70 WCPM Current Level:10 WCPM Difference to June Benchmark (Gap):60 WCPM Time to Benchmark: 27 Weeks Rate of Growth Required: 60/27= 2.2 WCPM for Carlos Peer Group Rate = 1.30 WCMP (for some risk benchmark) REALISTIC? Not unless you increase AET

72
Setting a Goal Baseline 100 90 80 70 60 50 40 30 20 10 Baseline Goal Student Improvement is Job #1 Goal Area Name Service Providers Parent Participation Carlos Reading Parent will provide extra oral reading time at home. They would like graph sent home biweekly. District School Year Teacher 10 Words Correct per Minute Goal By June, given a DIBELS monitoring passage Carlos will read 70 words correct in one minute. M M M M M M M M M M M M M M M M M M M M M M M M M M M M M Expected Level of Performance #1 #2 #3 #4 Russo Nov Dec Jan Feb Mar Apr May Jun Thats about 2.2 words per week! Challenging, but possible. Peers Growth (some risk) is about 1.3 words per week Aimline
 is about 1.3 words per week Aimline.")
73
In terms of establishing appropriate weekly rates of improvement when monitoring progress with oral passage reading, the student's grade level of functioning must be considered. Findings indicate that for first graders, an improvement of 2 words per week may represent a realistic slope. On the other hand, given research indicating the importance of ambitious goals to enhance student achievement (e.g., Fuchs, Fuchs, & Hamlett, 1989), an improvement of approximately 3 words per week (i.e., 2.10 plus one standard deviation of.80) may represent an appropriately ambitious standard for weekly growth. This may be especially true for students with disabilities who must decrease discrepancies between their performance and that of their peers. Realistic and ambitious standards for weekly growth, respectively, are: GradeRealisticAmbitious First2 words per week3 words per week Second1.5 words per week2.0 words per week Third1.0 word per week1.5 word per week Fourth.85 words per week1.1 words per week Fifth.5 word per week.8 word per week Sixth.3 words per week.65 words per week Fuchs, L. S. & Fuchs, D., Hamlett, C., Walz, L & Germann, G. (1993). Formative evaluation of academic progress: How much growth can we expect? School Psychology Review, 22(1), 22-49. Note: Table was created from article text. Reality Check for Goals Set Against Benchmarks
, an improvement of approximately 3 words per week (i.e., 2.10 plus one standard deviation of.80) may represent an appropriately ambitious standard for weekly growth. This may be especially true for students with disabilities who must decrease discrepancies between their performance and that of their peers. Realistic and ambitious standards for weekly growth, respectively, are: GradeRealisticAmbitious First2 words per week3 words per week Second1.5 words per week2.0 words per week Third1.0 word per week1.5 word per week Fourth.85 words per week1.1 words per week Fifth.5 word per week.8 word per week Sixth.3 words per week.65 words per week Fuchs, L. S. & Fuchs, D., Hamlett, C., Walz, L & Germann, G. (1993). Formative evaluation of academic progress: How much growth can we expect. School Psychology Review, 22(1), Note: Table was created from article text. Reality Check for Goals Set Against Benchmarks.")
74
Carlos Reading Goal By June, given a DIBELS monitoring passage, Carlos will read 70 words correct in one minute with five or fewer errors

75
Instructional Decision Making Decision Making Plan : Instructional Intervention Plan Student Intervention Designer Goal Area Advisor Phase Instructional Procedure Materials Arrangements Time Motivational Strategies Data will be collected at least once per week and charted. If three consecutive data points fall below the goal line the problem solving team will reconvene and an instructional change will be made. Carlos Reading Phillips 1 Teach phonemic awareness skills. Optimize Curriculum Small group Supplemental to Carlos' core reading 30 minutes Daily Verbal Praise 2 3

76
Instructional Decisions Instructional procedures Materials Arrangements Time Motivational Strategies

77
-Implement according to written plan -Ongoing systematic data collection -Follow-up as needed Evaluate Develop a Plan - Generate possible solutions -Evaluate solutions -Select a solution -Collect baseline data -Set a goal -Write action plan -Select measurement strategy -Develop plan to evaluate effectiveness Implement Plan Consultation with Extended Problem Solving Team Define the Problem -Identify concern -Define behavior of concern -Problem validation -Data analyzed to determine effectiveness -Success determined by rate of progress & size of discrepancy -Recycle or determine need to consider entitlement for special education -Problem analysis -Functional assessment -Write problem statement Parent Teacher BAT AEA Finally Here

78
Decision Making Plan Frequency of data collection Strategies to be used to summarize data for evaluation Number of data points or time before analysis Decision rule

79
Data Collection and Charting Supplemental Instruction 1 100 90 80 70 60 50 40 30 20 10 Baseline 1 Goal Vanderburgh Student Improvement is Job #1 Goal Area Name Service Providers Parent Participation Carlos Reading Parent will provide extra oral reading time at home. They would like graph sent home biweekly. District School Year Teacher Goal By June, given a DIBELS progress monitoring passage Carlos will read 70 words correct in one minute. M M M M M M M M M M M M M M M Nov Dec Jan Feb Mar Apr May Jun Trendline =.07 WCPM Poor RtI Aimline

80
Data-Based Determination of Expectations: Carlos Benchmark Level:70 WCPM Current Level:12 WCPM Difference to June Benchmark (Gap):58 WCPM Time to Benchmark: 20 Weeks Rate of Growth Required: 58/20= 2.9 WCPM for Carlos Peer Group Rate = 1.30 WCMP (for some risk benchmark) REALISTIC? Not unless you increase AET, increase effectiveness of instruction

81
Data Collection and Charting Supplemental Instruction 1 100 90 80 70 60 50 40 30 20 10 Baseline 1 Goal Vanderburgh Student Improvement is Job #1 Goal Area Name Service Providers Parent Participation Carlos Reading Parent will provide extra oral reading time at home. They would like graph sent home biweekly. District School Year Teacher Goal By June, given a DIBELS progress monitoring passage Carlos will read 70 words correct in one minute. M M M M M M M M M M M M M M M Nov Dec Jan Feb Mar Apr May Jun Trendline =.07 WCPM Aimline Thats about 2.9 words per week VERY Ambitious, but lets go with it.

82
Entitlement for Special Education Educational Progress DiscrepancyInstructional Needs Assessment and Progress Data From Problem Solving/RTI Process Group and Individual Interventions Convergence of Data from a Variety of Sources

83
At This Point We Know Carlos' Performance is significantly discrepant from peers (Somewhere between the 2 nd an 4 th percentile) – (Discrepancy in Level) His progress is about 50 WCPM discrepant from benchmark performance levels during the winter benchmark period (Discrepancy in Level) He has not made significant progress when provided supplemental instruction and this progress is documented with progress monitoring data (Discrepancy in Trend) We have a clear description of what his instruction needs to look like (problem analysis – phonemic awareness, phonics, fluency have clear deficits) Additional data were collected on other important variables (vision, hearing, parental input, teacher input etc.)
 – (Discrepancy in Level) His progress is about 50 WCPM discrepant from benchmark performance levels during the winter benchmark period (Discrepancy in Level) He has not made significant progress when provided supplemental instruction and this progress is documented with progress monitoring data (Discrepancy in Trend) We have a clear description of what his instruction needs to look like (problem analysis – phonemic awareness, phonics, fluency have clear deficits) Additional data were collected on other important variables (vision, hearing, parental input, teacher input etc.)")
84
Instructional Decision Making Decision Making Plan : Instructional Intervention Plan Student Intervention Designer Goal Area Advisor Phase Instructional Procedure Materials Arrangements Time Motivational Strategies Data will be collected at least once per week and charted. If three consecutive data points fall below the goal line the problem solving team will reconvene and an instructional change will be made. Carlos Reading Phillips D. Tilly 1 2 3 1 2 Teach phonemic awareness skills. Focus on transitioning activities. Provide cues when reading Optimize Curriculum Small group Supplemental to Carlos' core reading 30 minutes Daily Verbal Praise Add reading mastery instruction Add special Education instruction matched to student individual needs Intensive instruction 1 to 4 Teacher/student ratio Add 30 minutes Mystery Motivators

85
Data Collection and Charting Intensive Instruction 2 100 90 80 70 60 50 40 30 20 10 Baseline 1 Goal Vanderburgh Student Improvement is Job #1 Goal Area Name Service Providers Parent Participation Carlos Reading Parent will provide extra oral reading time at home. They would like graph sent home biweekly. District School Year Teacher 10 Words Correct per Minute Goal By June, given a DIBELS progress monitoring passage Carlos will read 70 words correct in one minute. M M M M M M M M M M M M M M M Nov Dec Jan Feb Mar Apr May Jun Trendline =.07 WCPM Trendline =.54 WCPM Poor RtI

86
Instructional Decision Making Decision Making Plan : Instructional Intervention Plan Student Intervention Designer Goal Area Advisor Phase Instructional Procedure Materials Arrangements Time Motivational Strategies Data will be collected at least once per week and charted. If three consecutive data points fall below the goal line the problem solving team will reconvene and an instructional change will be made. Carlos Reading Philips D. Tilly 1 2 3 Teach phonemic awareness skills. Focus on transitioning activities. Provide cues when reading Optimize Curriculum Small group Supplemental to Carlos' core reading 30 minutes Daily Verbal Praise Add additional explicit phonics Instruction Phonics for reading Intensive Instructional Group Small groups will rotate between teachers. Add 20 Minutes 3x per wk. Verbal Praise Classroom motivators Add reading mastery instruction (discontinue PfR) Add special Education instruction matched to student individual needs Intensive instruction 1 to 4 Teacher/student ratio Add 30 Minutes daily Mystery Motivators
 Add special Education instruction matched to student individual needs Intensive instruction 1 to 4 Teacher/student ratio Add 30 Minutes daily Mystery Motivators.")
87
Data Collection and Charting Intensive Instruction 2 100 90 80 70 60 50 40 30 20 10 Baseline 1 Goal Vanderburgh Student Improvement is Job #1 Goal Area Name Service Providers Parent Participation Carlos Reading Parent will provide extra oral reading time at home. They would like graph sent home biweekly. District School Year Teacher Goal By June, given a DIBELS progress monitoring passage Carlos will read 70 words correct in one minute. M M M M M M M M M M M M M M M Nov Dec Jan Feb Mar Apr May Jun Trendline =.07 WCPM Trendline =.17 WCPM Thats 4.16 WCPM Probably Not Reasonable

88
Data Collection and Charting Intensive Instruction 2 100 90 80 70 60 50 40 30 20 10 Baseline 1 Goal Vanderburgh Student Improvement is Job #1 Goal Area Name Service Providers Parent Participation Carlos Reading Parent will provide extra oral reading time at home. They would like graph sent home biweekly. District School Year Teacher Goal By June, given a DIBELS progress monitoring passage Carlos will read 70 words correct in one minute. M M M M M M M M M M M M M M M Nov Dec Jan Feb Mar Apr May Jun Trendline =.07 WCPM Trendline =.54 WCPM Use 2.0 as a challenging Goal (Fuchs et al.)
.")
89
Data-Based Determination of Expectations: Carlos Benchmark Level:70 WCPM Current Level:20 WCPM Difference to June Benchmark (Gap):50 WCPM Time to Benchmark: 12 Weeks Rate of Growth Required: 50/12= 4.16 WCPM for Carlos (Undoable) Will use 2.0 as a challenging goal Peer Group Rate = 1.30 WCMP (for some risk benchmark) REALISTIC? Not unless you increase AET/instruction becomes more effective

90
Data Collection and Charting Intensive Instruction 2 100 90 80 70 60 50 40 30 20 10 Baseline 1 Goal Vanderburgh Student Improvement is Job #1 Goal Area Name Service Providers Parent Participation Carlos Reading Parent will provide extra oral reading time at home. They would like graph sent home biweekly. District School Year Teacher Goal By June, given a DIBELS progress monitoring passage Carlos will read 70 words correct in one minute. M M M M M M M M M M M M M M M Nov Dec Jan Feb Mar Apr May Jun Trendline =.07 WCPM Trendline =.54 WCPM Trendline =1.93 WCPM Better, Good RtI

91
The Educational Stars Are Aligning No Child Left Behind Reading First IDEA Reauthorization Creates tremendous opportunity

Similar presentations


 & The IST Process>")


 in Primary Grades>")


 Version 1.2 Copyright 2011 Gary L. Cates, Ph.D. www.GaryCates.net START.>")
 Secondary Model for Intervention This ppt is an adaptation of a specific PISD Training on RTI, The Educational Testing and.>")

