Download presentation
Presentation is loading. Please wait.

1
Epidemiology of Physical Activity: 101 July 17, 2007 Steven H
Epidemiology of Physical Activity: 101 July 17, Steven H. Kelder, PhD, MPH Professor, Division of Epidemiology Co-Director, Michael & Susan Dell Center for Advancement of Healthy Living

2
The Dilemma Most Americans are not physically active enough to achieve substantial health benefit Related disease outcomes are very costly With adults, traditional PA promotion efforts have had limited effect Sustaining higher activity levels will require a comprehensive approach I would summarize our current dilemma this way: most of us are not physically active enough to achieve a substantial health benefit the human and financial burden from diseases related to physical inactivity is huge traditional efforts to promote physical activity have generally been limited to individual behavior change approaches, neglecting the role of the built environment comprehensive strategies to promote Active Living through community design must be an key piece of the puzzle

3
The World According to Steve
Start young – school based programs work. Children can be found at school. Young parents, preschool. Physical activity quickly declines as students enter middle school and high school (especially girls). Promote calcium consumption and weight bearing physical activities to women and girls. Reinforce school lessons at home and in the community. Promote use of community parks and recreation. Create social events; eating and PA are social behaviors. Where: worksites, point of purchase, church, school Stay in it for the long haul.
. Promote calcium consumption and weight bearing physical activities to women and girls. Reinforce school lessons at home and in the community. Promote use of community parks and recreation. Create social events; eating and PA are social behaviors. Where: worksites, point of purchase, church, school. Stay in it for the long haul.")
4
What Do We Mean by Food and Physical Activity Environments
What Do We Mean by Food and Physical Activity Environments? (from macro to micro) Physical and economic environments: food product (including packaging, portion size), price, promotion, placement – access, availability, affordability, convenience, parks and recreation Information environments: media, marketing, public education (including point of purchase information, food labels) Social environments: social and cultural norms/practices, role models; health provider and other social support for health behavior change Behavioral settings: schools, homes, neighborhoods, communities, youth-serving organizations, child care centers, grocery and convenience stores, restaurants/fast food outlets, vending machines, worksites Although genetic and biological factors are important at the individual level, and help to explain why some of us seem better able to resist weight gain in an increasingly toxic environment, the rapidity with which obesity has spread can only be explained by sweeping changes in the environment that have modified both caloric intake and energy expenditure.
 Physical and economic environments: food product (including packaging, portion size), price, promotion, placement – access, availability, affordability, convenience, parks and recreation. Information environments: media, marketing, public education (including point of purchase information, food labels) Social environments: social and cultural norms/practices, role models; health provider and other social support for health behavior change. Behavioral settings: schools, homes, neighborhoods, communities, youth-serving organizations, child care centers, grocery and convenience stores, restaurants/fast food outlets, vending machines, worksites. Although genetic and biological factors are important at the individual level, and help to explain why some of us seem better able to resist weight gain in an increasingly toxic environment, the rapidity with which obesity has spread can only be explained by sweeping changes in the environment that have modified both caloric intake and energy expenditure.")
5
The (possible) causes Mass media saturated with unhealthy messages and advertising Proliferation of easily available low nutrient, calorie dense foods Increasing frequency of restaurant eating and larger portion sizes (Super Size Me!)
")
6
The (possible) causes Increasing amount of time spent indoors with mass media and games Increased car travel and less person-powered transport Increased concerns over child safety - stranger danger and traffic Fewer walkable destinations - shops, grocery, post office

7
The (possible) causes More families with two working parents “Go inside and lock the door until we get home” Parents working longer hours - too tired and too busy to play Personal injury litigation and reduced opportunities for physical activity Poor fundamental movement skills - as children participate less, they fail to develop these fundamental skills so want to participate less

8
The (possible) causes Schools increasingly reluctant to devote time to health education Poor fundamental movement skills - as children participate less, they fail to develop these fundamental skills so want to participate less

13
Increased Life Expectancy
Increased years due to public health measures: 25 Increased years due to medical care advances: 5 Source: Centers for Disease Control and Prevention (CDC).
.")
14
Causes of Death in United States – 2002
Actual Causes of Death2 Leading Causes of Death1 Heart Disease Tobacco Cancer Poor diet/ lack of exercise3 Stroke Alcohol Chronic lower respiratory disease Infectious agents Unintentional Injuries Pollutants/toxins Diabetes Firearms Pneumonia/influenza Sexual behavior Alzheimer’s disease Motor vehicles Kidney Disease Illicit drug use Percentage (of all deaths) Percentage (of all deaths) Sources: 1 National Vital Statistics Reports, Vol. 53, No. 15, February 28, 2005. 2 Adapted from McGinnis Foege, updated by Mokdad et. al., 2000. 3 JAMA, April 20, 2005—Vol 293, No. 15, pg 1861.
 Percentage (of all deaths) Sources: 1 National Vital Statistics Reports, Vol. 53, No. 15, February 28, Adapted from McGinnis Foege, updated by Mokdad et. al., JAMA, April 20, 2005—Vol 293, No. 15, pg")
15
Physical Activity and Fitness Benefits
Builds and maintains healthy bones and muscles, controls weight, builds lean muscle, reduces fat, reduces blood pressure, and improves blood glucose control Decreases the risk of obesity and chronic diseases (CHD, high blood pressure, diabetes, colon cancer, and osteoporosis) Reduces feelings of depression and anxiety and promotes psychological well-being Related to functional independence of older adults and quality of life of people of all ages
 Reduces feelings of depression and anxiety and promotes psychological well-being. Related to functional independence of older adults and quality of life of people of all ages.")
16
Physical Activity Improves Lives A physically active Texas population would expect to see:
30 % fewer cases of heart disease, stroke, colon cancer, and osteoporosis 18 % fewer cases of type 2 diabetes and hypertension 16 % fewer injuries from falls in the elderly 12 % fewer cases of depression and anxiety 5 % fewer cases of breast cancer PA helps the elderly maintain their independence longer. PA results in more productive employees by decreasing illness and absenteeism.

17
Sedentary Behavior is a Natural Response to our Environment
Our culture increasingly values cars, television, computers, and convenience, making physical activity less a natural part of our lives. Newer communities are often designed without sidewalks or streetlights, decreasing walkability. Communities are designed with housing far from schools, shopping, or other activities, making walking or biking for transportation infeasible. Increasing traffic congestion and aggressive driving hampers the walkability of neighborhoods. More and more employees have sedentary jobs decreasing the amount of activity incurred during daily routines. Children are taking fewer physical education classes in school.

18
Activity can be Easy Achieving the recommended amount of physical activity is as simple as taking three ten-minute walks per day. Health benefits occur even with very modest increases in activity, even if the recommendation is not met. The largest benefits occur to those who were previously completely sedentary. Any incremental physical activity is beneficial to health. Vigorous exercise is very beneficial to health, but a brisk walk is beneficial as well. Little changes, such as parking farther away from the store or opting for the stairs instead of the elevator, go a long way toward promoting health and preventing disease.

19
Dietary Guidelines for Americans
Aim for Fitness Aim for a healthy weight Be physically active each day Build a Healthy Base Let the Pyramid guide your food choices Choose a variety of grains daily, especially whole grains Choose a variety of fruits and vegetables daily Keep food safe to eat

20
Dietary Guidelines for Americans
Choose Sensibly Choose a diet that is low in saturated fat and cholesterol and moderate in total fat Choose beverages and foods to moderate your intake of sugars Choose and prepare foods with less salt If you drink alcoholic beverages, do so in moderation

21
Vegetables and Fruits 5 or more servings of vegetables and fruits each day Research suggests this one dietary change could prevent as many as 20% of all cancers Vegetables and fruits provide vitamins, minerals, and phytochemicals Variety is important to get the widest array – dark green, deep orange, citrus

22
Other Plant-based Foods
7 or more servings of other plant-based foods such as whole grains and legumes Whole grains are higher in fiber, vitamins, minerals, and phytochemicals than refined grains

23
The New American Plate 2/3 or more of the plate should be covered by plant-based foods – vegetables, fruits, whole grains, and beans – 1 or more vegetables or fruits and not just grain products 1/3 or less of the plate should be covered by meat, fish, poultry, or low-fat dairy

24
Physical Activity Engage in regular physical activity and reduce sedentary activities to promote health, psychological well-being, and a healthy body weight. Achieve physical fitness by including cardiovascular conditioning, stretching, and resistance exercises. Children and adolescents – At least 60 minutes on most, preferably all, days of the week.

25
New for 2005 Specificity of recommendations
At least 30 minutes to reduce risk of chronic disease Up to 60 minutes of moderate to vigorous physical activity may be needed to prevent gradual weight gain that occurs over time 60 to 90 minutes of moderate-intensity physical activity to sustain weight loss Recommendations for specific populations Those who need to lose weight, overweight children, pregnant women, breastfeeding women, overweight adults and overweight children with chronic diseases and/or on medication

26
Change May Occur Slowly

27
U.S. Obesity and Diabetes Trends in
The data shown in these maps were collected through CDC’s Behavioral Risk Factor Surveillance System (BRFSS). Source: Mokdad AH, Serdula MK, Dietz WH, et al. JAMA, October 27, 1999; 282(16):
. Source: Mokdad AH, Serdula MK, Dietz WH, et al. JAMA, October 27, 1999; 282(16):")
28
Obesity Trends* Among U.S. Adults BRFSS, 1985
(*BMI ≥30, or ~ 30 lbs overweight for 5’ 4” person) No Data <10% %–14%
 No Data <10% 10%–14%")
29
Obesity Trends* Among U.S. Adults BRFSS, 1990
(*BMI ≥30, or ~ 30 lbs overweight for 5’ 4” person) No Data <10% %–14%
 No Data <10% 10%–14%")
30
Obesity Trends* Among U.S. Adults BRFSS, 1995
(*BMI ≥30, or ~ 30 lbs overweight for 5’ 4” person) No Data <10% %–14% %–19%
 No Data <10% 10%–14% 15%–19%")
31
Obesity Trends* Among U.S. Adults BRFSS, 2000
(*BMI ≥30, or ~ 30 lbs overweight for 5’ 4” person) No Data <10% %–14% %–19% ≥20
 No Data <10% 10%–14% 15%–19% ≥20.")
32
Obesity Trends* Among U.S. Adults BRFSS, 2004
(*BMI ≥30, or ~ 30 lbs overweight for 5’ 4” person) We have never had an epidemic like this that we have been able to track so thoroughly and see. As I told you, this is conservative. About 60 million adults, or 30 percent of the adult population, are now obese, which represents a doubling of the rate since 1980. No Data <10% %–14% %–19% %–24% ≥25%
 We have never had an epidemic like this that we have been able to track so thoroughly and see. As I told you, this is conservative. About 60 million adults, or 30 percent of the adult population, are now obese, which represents a doubling of the rate since No Data <10% 10%–14% 15%–19% 20%–24% ≥25%")
33
Diabetes Trends. Among Adults in the U. S
Diabetes Trends* Among Adults in the U.S., (Includes Gestational Diabetes) BRFSS 1990 No Data <10% %–14% %–19% %–24% ≥25% Source: Mokdad et al., Diabetes Care 2000;23:
 BRFSS No Data <10% 10%–14% 15%–19% 20%–24% ≥25% Source: Mokdad et al., Diabetes Care 2000;23:")
34
Diabetes Trends. Among Adults in the U. S
Diabetes Trends* Among Adults in the U.S., (Includes Gestational Diabetes) BRFSS 1995 No Data <10% %–14% %–19% %–24% ≥25% Source: Mokdad et al., Diabetes Care 2000;23:
 BRFSS No Data <10% 10%–14% 15%–19% 20%–24% ≥25% Source: Mokdad et al., Diabetes Care 2000;23:")
35
Diabetes Trends. Among Adults in the U. S
Diabetes Trends* Among Adults in the U.S., (Includes Gestational Diabetes) BRFSS 2000 No Data <10% %–14% %–19% %–24% ≥25% Source: Mokdad et al., J Am Med Assoc 2001;286:10.
 BRFSS No Data <10% 10%–14% 15%–19% 20%–24% ≥25% Source: Mokdad et al., J Am Med Assoc 2001;286:10.")
36
Diabetes Trends. Among Adults in the U. S
Diabetes Trends* Among Adults in the U.S., (Includes Gestational Diabetes) BRFSS 2001 No Data <10% %–14% %–19% %–24% ≥25% Source: Mokdad et al., J Am Med Assoc 2001;286:10.
 BRFSS No Data <10% 10%–14% 15%–19% 20%–24% ≥25% Source: Mokdad et al., J Am Med Assoc 2001;286:10.")
37
Source: Ogden et al., JAMA, 2006
Prevalence of Obesity* in Adults by Gender and Race *BMI > 30 NHANES These are the most recent prevalence figures we have on overweight in adults broken down by gender and race. Note that these figures include both “overweight” and “obese” individuals together (BMI > 25). Females tend to be heavier, especially minority females. These data are from NHANES III, in which these people were actually weighed and measured for height. Note that African American and Hispanic females are approximately 50% overweight. Source: Ogden et al., JAMA, 2006
. Females tend to be heavier, especially minority females. These data are from NHANES III, in which these people were actually weighed and measured for height. Note that African American and Hispanic females are approximately 50% overweight. Source: Ogden et al., JAMA,")
38
Most Recent NHANES Results
66.3% of American adults are overweight (BMI ≥ 25) 4.8% of American adults are extremely obese (BMI ≥ 40) 10.5% of Non-Hispanic Black JAMA, 2006:295:
 4.8% of American adults are extremely obese (BMI ≥ 40) 10.5% of Non-Hispanic Black. JAMA, 2006:295:")
39
Costs of Obesity $75 billion: Annual U.S. medical expenditures attributed to obesity in 2003 Amount obese people spent on health care costs compared to normal weight people: 37% more For Youth (6-17 years) between 1979 and 1999: Hospital discharges for diabetes were nearly 2x Sleep apnea increased 5x Obesity-associated costs were $35 million during and increased to $127 million during Annual costs associated with overweight and obesity in Texas in 2001: $10.5 billion dollars Projected costs for 2040 in Texas: $39 billion in Texas Used the 1994 national health interview survey. Put figures at 4.32% of national health expenditures Sources: Surgeon General’s Report on Obesity, 2001; Finkelstein et al., 2004; Thorpe et al., 2004; Wang & Dietz,
 between 1979 and 1999: Hospital discharges for diabetes were nearly 2x. Sleep apnea increased 5x. Obesity-associated costs were $35 million during and increased to $127 million during Annual costs associated with overweight and obesity in Texas in 2001: $10.5 billion dollars. Projected costs for 2040 in Texas: $39 billion in Texas. Used the 1994 national health interview survey. Put figures at 4.32% of national health expenditures. Sources: Surgeon General’s Report on Obesity, 2001; Finkelstein et al., 2004; Thorpe et al., 2004; Wang & Dietz,")
40
Figure 1. Prevalence of BMI > 30 within BMI category; 11th grade
Female Male W = White, H = Hispanic, A = African American

41
2001 Grade 5 SAT 9 and Physical Fitness
Stanford Achievement Test Gives to students in grades 5, 7 & 9 Used Fitnessgram to assess physical fitness CA Dept. of Education, 2002

42
2001 Grade 7 SAT 9 and Physical Fitness
Stanford Achievement Test Gives to students in grades 5, 7 & 9 Used Fitnessgram to assess physical fitness CA Dept. of Education, 2002

43
2001 Grade 9 SAT 9 and Physical Fitness
Stanford Achievement Test Gives to students in grades 5, 7 & 9 Used Fitnessgram to assess physical fitness Fitnessgram uses criterion-referenced standards to evaluate fitness. These represent a level of fitness that offers some degree of protection against chronic disease. Achievement of fitness standards is basd upon a test score that falls in the Healthy Fitness Zone. Each of the 6 tasks measures a different aspect of fitness. CA Dept. of Education, 2002

44
Defining Physical Activity
Physical Activity = any bodily movement produced by skeletal muscles that results in an energy expenditure. It can be categorized in various ways, including type, intensity, and purpose. In terms of disease prevention, the activity usually considered is aerobic in nature, with large muscle groups contracting in a continuous manner Physical activity can be seen as a broader term than exercise

45
Defining Physical IN-Activity
Physical IN-Activity = a level of activity less than that needed to maintain good health. Inactive as per CDC: less than 10 minutes per week of moderate or vigorous physical activity Sallis and Owen, 1999: People are considered sedentary when they report no physical New Description! = Screen Time Physical activity can be seen as a broader term than exercise

46
Defining Physical Fitness
Physical Fitness = The ability to carry our daily tasks with vigor and alertness, without undue fatigue, and with ample energy to enjoy leisure-time pursuits and to meet unforeseen emergencies. A measure of a person’s ability to perform physical activities that require endurance, strength, flexibility Physical fitness is a measure of a person’s performance to perform physical activities Fitness is a state of being that many people strive for

47
Defining Exercise Exercise = physical activity that is planned or structured Repetitive movement to improve/ maintain: Aerobic capacity Muscular strength Muscular endurance Flexibility Body composition The term exercise is commonly used interchangeably with physical activity but it refers to structured activities for attaining physical fitness. Exercise can increase aerobic conditioning, strength, endurance, flexibility, and body composition

48
Quantifying PA measures
Need PA intensity measure Need frequency Need duration Body weight may be needed

49
Outcome Measures 5 Health Related Components of PA
Caloric Expenditure (CE) Activity Intensity (AI) Weight Bearing (WB) Flexibility (FL) Musculoskeletal (MS)
 Activity Intensity (AI) Weight Bearing (WB) Flexibility (FL) Musculoskeletal (MS)")
50
Physical activity intensity is frequently quantified in terms of metabolic equivalents, or METS
1 MET is rest (as in, 1 times your resting metabolic rate) 1 MET = 1 kcal/kg/hr All activities are some multiple of this resting MET level
 1 MET = 1 kcal/kg/hr. All activities are some multiple of this resting MET level.")
52
Defining Recommended Activity
Recommended Activity = minimum amount of physical activity required for health benefits Either regular moderate or vigorous activities equivalent to burn 150 calories/day (1,000 calories/wk) Recommended activity is the minimum amount of activity for achieving a health benefit That translates to the activity required to burn 150 calories per day, which can be accomplished with longer bouts of moderate activity or shorter bouts of vigorous activity
 Recommended activity is the minimum amount of activity for achieving a health benefit. That translates to the activity required to burn 150 calories per day, which can be accomplished with longer bouts of moderate activity or shorter bouts of vigorous activity.")
53
Physical Activity Types/Examples
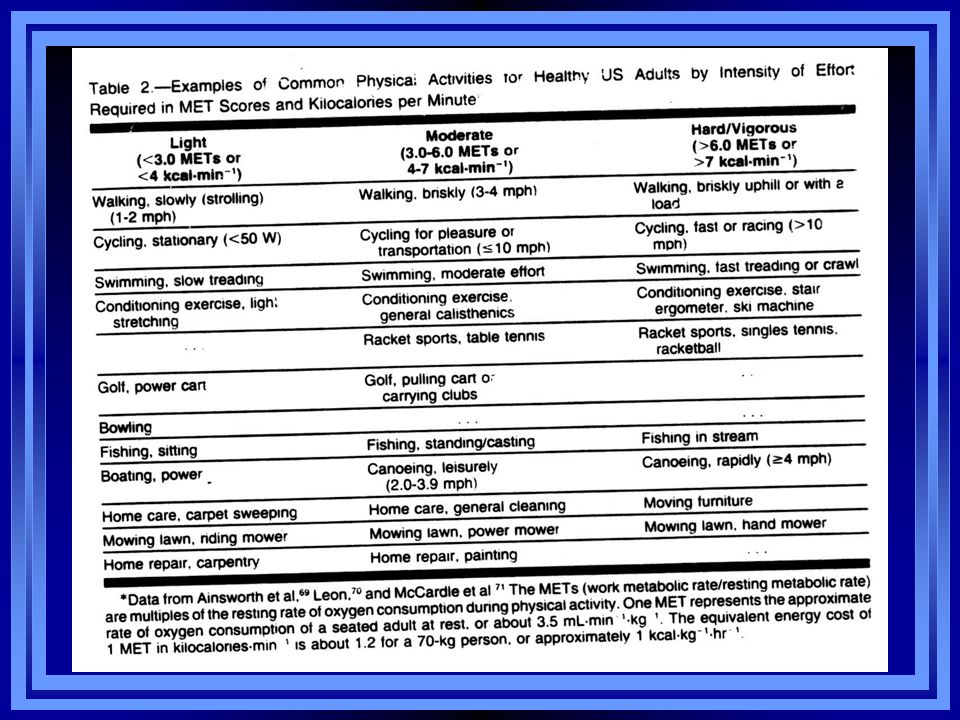
Vigorous Activities Brisk walking or climbing uphill High Impact Aerobics Step aerobics Swim laps Bicycling (hills) Jogging Moderate Activities Walking mph (level surface) Low Impact Aerobics Swimming Bicycling (level ground) Mowing grass Physical activities are categorized as vigorous, moderate, and light Vigorous activities include… Moderate activities include… Note: Intensity of activity is often determined in metabolic equivalents (METS). METS estimate the metabolic cost of activity;1 MET=resting metabolic rate.
 Jogging. Moderate Activities. Walking mph (level surface) Low Impact Aerobics. Swimming. Bicycling (level ground) Mowing grass. Physical activities are categorized as vigorous, moderate, and light. Vigorous activities include… Moderate activities include… Note: Intensity of activity is often determined in metabolic equivalents (METS). METS estimate the metabolic cost of activity;1 MET=resting metabolic rate.")
54
Measurement Survey: diary, recall, quantitative history, global self-report. Direct observation, job classification Heart rate monitor, motion sensors, pedometer, gait assessment, accelerometers. Direct calorimetry (heat), indirect calorimetry (oxygen), cycle, treadmill, doubly labeled water (H and O). 1.) Just to point out the different levels of precision with measurement. The data I will be presenting tonight is based on self-report, and thus, there may be more issues with measurement error- both in terms of validity of instruments in measuring physical activity as well as the biases the go along with data based on self-report. Calorimetry: some type of chamber to measure heat; doubly labeled water: they put an isotope and then measure urine… Gait analysis is the technical part of gait assessment. The patient walks up and down the laboratory, while special television cameras observe the positions of reflectors fixed to their skin. A computer uses these observations to provide detailed information on the way the patient walks.
, indirect calorimetry (oxygen), cycle, treadmill, doubly labeled water (H and O). 1.) Just to point out the different levels of precision with measurement. The data I will be presenting tonight is based on self-report, and thus, there may be more issues with measurement error- both in terms of validity of instruments in measuring physical activity as well as the biases the go along with data based on self-report. Calorimetry: some type of chamber to measure heat; doubly labeled water: they put an isotope and then measure urine… Gait analysis is the technical part of gait assessment. The patient walks up and down the laboratory, while special television cameras observe the positions of reflectors fixed to their skin. A computer uses these observations to provide detailed information on the way the patient walks.")
55
Doubly Labeled Water Drink water with 2H and 18O isotopes (natural isotopes) Urine or saliva samples collected pre-drink, and every few days up to ~14 days Assumption: 2H disappears in H2O and 18O disappears in H2O and CO2 removal Differential loss is equivalent to EE

56
Doubly Labeled Water 3 Disadvantages
Isotope is very expensive (~$500 per subject) Expensive equipment needed for analysis Assumes that CO2 ~ O2 Only Total EE is measured Components of PA?
 Expensive equipment needed for analysis. Assumes that CO2 ~ O2. Only Total EE is measured. Components of PA")
57
Activity Monitors Assessing PA
What are accelerometers? They measure accelerations of the human body They record activity patterns over a period of time Benefits: small, non-invasive, large storage capacity, used widely in field settings Different types: Actigraph (or CSA) - most widely used Caltrac - estimates energy expenditure Tritrac - measures PA in 3 directions (Welk, 2002)
 - most widely used. Caltrac - estimates energy expenditure. Tritrac - measures PA in 3 directions. (Welk, 2002)")
58
The Actigraph Records levels of PA Worn on waist, wrist or ankle
Records frequency, time and intensity of PA Can detail percentage time spent at different activity levels Monitors continuously

59
Paediatric monitoring
Used in the Liverpool Sporting Playgrounds Project Quantified intensity, duration and frequency of activity in playtime (10 year-old girl's data shown) Moderate PA: 46% (6½ mins) High PA: 11% (1¾ mins) Very high PA: 5.6% (1 min)
 Moderate PA: 46% (6½ mins) High PA: 11% (1¾ mins) Very high PA: 5.6% (1 min)")
60
Heart Rate Monitors HRM measure cardiorespiratory response to physical activity Transmitter and belt worn around the upper body Data commonly displayed on a wrist receiver Downloaded via interface for analysis

61
Heart Rate Monitors Advantages Limitations
Relationship with energy expenditure Valid & reliable in lab & field Describes tempo Easy & quick for data collection & analyses Limitations Cost (large samples) Data attrition Discomfort over long periods Age, sex, training status affect HR No information on physical activity context
 Data attrition. Discomfort over long periods. Age, sex, training status affect HR. No information on physical activity context.")
62
Direct observation instruments
Measure behavioural aspects of physical activity Provides information on specific activities occurring in a variety of settings over time Quantitative & qualitative information Useful with younger children Trained observers Pen and paper instruments

63
Direct observation instruments
Advantages Detailed quantitative & qualitative data Describes tempo Low financial cost Computer software allows real time recording & analysis of data Limitations Time-intensive training Time & labour intensive data collection Limited sample sizes Observer presence (reactivity) Limited validation against physiological criteria
 Limited validation against physiological criteria.")
64
System for Observing Children's Activity during Playtime (SOCAP) Recording Form
Time Area Activity Activities Behaviour Other Level B St T A T to LA 4G W W & T Linked arms B V Tick 2B W-V Chasing PF System for Observing Children's Activity during Playtime (SOCAP) Assesses levels of activity engaged in on playground & types of activities (e.g. skipping) Details main behaviours displayed during playtime (e.g. play fighting, arguing) Benefits: combines PA with behaviours and identifies contextual influences on PA Limitations: new measure which is currently undergoing reliability & validity studies
 Assesses levels of activity engaged in on playground & types of activities (e.g. skipping) Details main behaviours displayed during playtime (e.g. play fighting, arguing) Benefits: combines PA with behaviours and identifies contextual influences on PA. Limitations: new measure which is currently undergoing reliability & validity studies.")
65
Physical Activity Questionnaires
International Physical Activity Questionnaire (IPAQ) Physical Activity Questionnaire for Adolescents (PAQ-A) Leisure Time Exercise Questionnaire (LTEQ) Advantages Inexpensive, allows large sample size. Can be administered quickly and easily. Limitations Reliability and validity problems associated with recall of activity, especially in children. Lack objectivity. Various types of questionnaire that can be used to measure PA Self-report questionnaire Interviewer administered questionnaires Proxy (e.g. given by parents on their child’s PA levels) reports PAQ-A (Kowalski et al., 1997) and LTEQ (Godin and Shepard, 1985) Objective: to classify individuals into broad categories of activity and provide some basic quantification of the major behavioural characteristics of the activity patterns reported. Useful for descriptive studies designed to assess the prevalence of various activity patterns in large populations. Questionnaires are relatively inexpensive and enable PA to be estimated in large numbers of individuals while maintaining low investigator burden. BUT there are some inherent problems associated with recall of PA especially in children and the data collected are largely subjective. The IPAQ measures frequency, intensity and duration BUT not type of PA. Measures = Frequency, Intensity, Time (and Energy Expenditure).
 Physical Activity Questionnaire for Adolescents (PAQ-A) Leisure Time Exercise Questionnaire (LTEQ) Advantages. Inexpensive, allows large sample size. Can be administered quickly and easily. Limitations. Reliability and validity problems associated with recall of activity, especially in children. Lack objectivity. Various types of questionnaire that can be used to measure PA. Self-report questionnaire. Interviewer administered questionnaires. Proxy (e.g. given by parents on their child’s PA levels) reports. PAQ-A (Kowalski et al., 1997) and LTEQ (Godin and Shepard, 1985) Objective: to classify individuals into broad categories of activity and provide some basic quantification of the major behavioural characteristics of the activity patterns reported. Useful for descriptive studies designed to assess the prevalence of various activity patterns in large populations. Questionnaires are relatively inexpensive and enable PA to be estimated in large numbers of individuals while maintaining low investigator burden. BUT there are some inherent problems associated with recall of PA especially in children and the data collected are largely subjective. The IPAQ measures frequency, intensity and duration BUT not type of PA. Measures = Frequency, Intensity, Time (and Energy Expenditure).")
66
Pedometers Ped- Walk Meters-measure Fixed to waistband
Small-light-unobtrusive Display:- Steps Distance Kcals Target:- Adult:- 10,000 steps/day Children:- 127 steps per minute. 60 mins=8000 steps/day

67
Expediency vs Accuracy
Heart rate monitoring Accelerometry Actiheart GPS systems Direct Observation Doubley labelled water Questionnaires Long Short Pedometers Cost

68
Physical Activity Surveillance
Routine surveillance Youth Risk Behavior Survey Behavior Risk Factor Surveillance System National Health and Nutrition Examination Survey National Health Interview Survey National Personal Transportation Survey Pediatric Nutrition Surveillance System Cross-sectional or population studies

69
Guide to Community Preventive Services (www.thecommunityguide.org/pa)
Community-wide campaigns. Large-scale, highly visible, multicomponent campaigns with messages promoted to large audiences through diverse media, including television, radio, newspapers, movie theaters, billboards, and mailings. Individually targeted programs. Programs tailored to a person’s readiness for change or specific interests; these programs help people incorporate physical activity into their daily routines by teaching them behavioral skills such as setting goals, building social support, rewarding themselves for small achievements, solving problems, and avoiding relapse. School-based physical education (PE). School curricula and policies that require students to engage in sufficient moderate to vigorous activity while in school PE class. Schools can accomplish this by increasing the amount of time students spend in PE class or by increasing their activity level during PE class.
. School curricula and policies that require students to engage in sufficient moderate to vigorous activity while in school PE class. Schools can accomplish this by increasing the amount of time students spend in PE class or by increasing their activity level during PE class.")
70
Guide to Community Preventive Services (www.thecommunityguide.org/pa)
Interventions that provide social support for physical activity in community settings. Interventions designed to promote physical activity by helping people create, strengthen, and maintain social networks that support their efforts to exercise more; examples include exercise buddy programs and the establishment of exercise contracts or walking groups. Interventions to provide people greater access to places for physical activity. Examples include building walking or biking trails and making exercise facilities available in community centers or workplaces.

71
U.S. and Texas adults who meet physical activity guidelines- 2003
Mod PA: 47% for U.S. compared to 44% for Texas; 26% for both 1.) more than 50% of Americans do not get enough PA to provide health benefits 2.) 26% are not active at all in their leisure time. Source: CDC BRFSS
 more than 50% of Americans do not get enough PA to provide health benefits. 2.) 26% are not active at all in their leisure time. Source: CDC BRFSS.")
72
Physical activity among U.S. adults by gender- 2003
Mod PA= moderate intensity activities as reported in a week for 30 minutes per day, five days a week; Inactive: less than 10 minutes total per week of moderate or vigorous PA Source: CDC BRFSS

73
Physical activity among U.S. adults by race/ethnicity- 2003
Mod PA= moderate intensity activities as reported in a week for 30 minutes per day, five days a week; Inactive: less than 10 minutes total per week of moderate or vigorous PA Source: CDC BRFSS

74
Physical activity among U.S. adults by age- 2003
Mod PA= moderate intensity activities as reported in a week for 30 minutes per day, five days a week; Inactive: less than 10 minutes total per week of moderate or vigorous PA Source: CDC BRFSS

75
Percentage of U.S. adults who meet physical activity recommendations by education level: 2003
Recommended physical activity is defined as reported moderate-intensity activities in a usual week (i.e., brisk walking, bicycling, vacuuming, gardening, or anything else that causes small increases in breathing or heart rate) for at least 30 minutes per day, at least 5 days per week; or vigorous-intensity activities in a usual week (i.e., running, aerobics, heavy yard work, or anything else that causes large increases in breathing or heart rate) for at least 20 minutes per day, at least 3 days per week or both. This can be accomplished through lifestyle activities (i.e., household, transportation, or leisure-time activities). Source: CDC BRFSS
 for at least 30 minutes per day, at least 5 days per week; or vigorous-intensity activities in a usual week (i.e., running, aerobics, heavy yard work, or anything else that causes large increases in breathing or heart rate) for at least 20 minutes per day, at least 3 days per week or both. This can be accomplished through lifestyle activities (i.e., household, transportation, or leisure-time activities). Source: CDC BRFSS.")
76
Physical activity among U.S. adults by poverty level- 1999-2001
Percent distributions of times per week engaged in vigorous and moderate leisure-time physical activity for adults 18 years of age and over, by selected characteristics: United States, average annual, 1999–2001 Source: NHIS

77
No leisure-time physical activity among U. S
No leisure-time physical activity among U.S. adults by poverty level No moderate PA ranges from 61.5% for below poverty level to 36.5% for 4 times the poverty level; Vigorous 72.9% for below poverty to 47.3% for 4xs poverty. Source: NHIS

78
Physical Activity & U.S. Adults
Prevalence More than 50% of adult Americans do not get enough PA to provide health benefits 26% are not active at all in their leisure time (BRFSS, 2003;)/ 38.6% according to National Health Interview Survey Gender Men (64.2%) more likely than women (59%) to engage in some leisure-time physical activity; Men more likely than women to engage in light moderate and/or vigorous physical activity than women five times per week. (NHIS, CDC 2004). Ethnicity White adults (63.5%) and Asian adults (61.9%) were more likely than African American adults to engage in some leisure-time physical activity (NHIS, CDC 2004). White adults (49%) more likely to meet moderate PA guidelines compared to African American (36%) and Hispanics (37%). (BRFSS, 2003) Whites (12%) reported lower inactivity compared to African Americans (24%) and Hispanics (26%) (BRFSS, 2003) Is increase in Moderate PA due to measurement, with accumulated PA accounting for increase? Source: CDC
/ 38.6% according to National Health Interview Survey Gender. Men (64.2%) more likely than women (59%) to engage in some leisure-time physical activity; Men more likely than women to engage in light moderate and/or vigorous physical activity than women five times per week. (NHIS, CDC 2004). Ethnicity. White adults (63.5%) and Asian adults (61.9%) were more likely than African American adults to engage in some leisure-time physical activity (NHIS, CDC 2004). White adults (49%) more likely to meet moderate PA guidelines compared to African American (36%) and Hispanics (37%). (BRFSS, 2003) Whites (12%) reported lower inactivity compared to African Americans (24%) and Hispanics (26%) (BRFSS, 2003) Is increase in Moderate PA due to measurement, with accumulated PA accounting for increase Source: CDC.")
79
Physical Activity & U.S. Adults
Age Engagement in physical activity declines steadily with age. Education Physical activity increases with educational level. Adults with a graduate degree (81%) were about twice as likely as adults with less than a high school diploma (41%) to engage in at least some leisure-time physical activity (NHIS, 2004). Adults with highest educational attainment were almost twice as likely as adults with the least education to engage in light-moderate or vigorous activities five or more times per week (NHIS, 2004). Women with a bachelor’s degree & graduate-level degree were four times as likely as women with less than a high school diploma to engage in strengthening exercise. (NHIS, 2004) Poverty Adults with incomes four times the poverty level or more (29.1%) were more likely than adults with incomes below the poverty level (20.5%) to engage in light-moderate physical activity at least five times per week and more than two times as likely to engage in vigorous physical activity (17.9% and 7.0%, respectively). Is increase in Moderate PA due to measurement, with accumulated PA accounting for increase? Source: CDC
 were about twice as likely as adults with less than a high school diploma (41%) to engage in at least some leisure-time physical activity (NHIS, 2004). Adults with highest educational attainment were almost twice as likely as adults with the least education to engage in light-moderate or vigorous activities five or more times per week (NHIS, 2004). Women with a bachelor’s degree & graduate-level degree were four times as likely as women with less than a high school diploma to engage in strengthening exercise. (NHIS, 2004) Poverty. Adults with incomes four times the poverty level or more (29.1%) were more likely than adults with incomes below the poverty level (20.5%) to engage in light-moderate physical activity at least five times per week and more than two times as likely to engage in vigorous physical activity (17.9% and 7.0%, respectively). Is increase in Moderate PA due to measurement, with accumulated PA accounting for increase Source: CDC.")
80
Physical Activity & U.S. Adults
Geographic Region Adults living in the West were more likely to engage in any regular physical activity (35%) and adults living in the south (28.4%) were least likely to engage in any regular physical activity. Adults living in a Metropolitan Statistical Area were more likely than adults living outside an MSA and adults living in the central city of an MSA to engage in at least some leisure-time physical activity (64%, 59%, and 59%, respectively). Marital Status Married women (61.0%) were more likely than women in any other marital status group to engage in at least some leisure-time physical activity. (NHIS- CDC, 2004) Widowed adults (23.6%) were less likely than never married (33.0%), married (31.1%) and divorced or separated adults (29.1%) to engage in regular physical activity. Adults who had never been married (27.5%) were more likely than adults in any other marital status group to engage in strengthening activities. (NHIS – CDC-NCHS, 2004) Trends Leisure-time physical activity appears to have increased slightly from 1991 (71.3%) to 2003 (75.6%) Is increase in Moderate PA due to measurement, with accumulated PA accounting for increase? Source: CDC-NCHS: National Health Interview Survey,
 and adults living in the south (28.4%) were least likely to engage in any regular physical activity. Adults living in a Metropolitan Statistical Area were more likely than adults living outside an MSA and adults living in the central city of an MSA to engage in at least some leisure-time physical activity (64%, 59%, and 59%, respectively). Marital Status. Married women (61.0%) were more likely than women in any other marital status group to engage in at least some leisure-time physical activity. (NHIS- CDC, 2004) Widowed adults (23.6%) were less likely than never married (33.0%), married (31.1%) and divorced or separated adults (29.1%) to engage in regular physical activity. Adults who had never been married (27.5%) were more likely than adults in any other marital status group to engage in strengthening activities. (NHIS – CDC-NCHS, 2004) Trends Leisure-time physical activity appears to have increased slightly from 1991 (71.3%) to 2003 (75.6%) Is increase in Moderate PA due to measurement, with accumulated PA accounting for increase Source: CDC-NCHS: National Health Interview Survey,")
81
U.S. Youth Participation in Sufficient Vigorous (V) and Moderate (M) Physical Activity Levels by Gender (Grades 9-12) Vig: Female: white; 44.9 black, 51.8 Hispanic; Male: 71.9; 65.0; 66.7; mod female: 23.2 white, 17.5 AA, 20.6 Hispanic; male; 28.9 white, 25,8 AA, 23.3 Hispanic 1.) More than a third of young people in grades 9-12 do not engage in sufficient vigorous physical activity. Source: CDC YRBS 2003
 More than a third of young people in grades 9-12 do not engage in sufficient vigorous physical activity. Source: CDC YRBS")
82
U.S. Youth Participation in Sufficient Vigorous and Moderate Physical Activity Levels by Ethnicity (Grades 9-12): 2003 Vigorous: white (65.2), black (54.8), hispanic (59.3); Moderate: white (26.2), black (21.7), Hispanic (22.0) Source: CDC YRBS 2003
, black (54.8), hispanic (59.3); Moderate: white (26.2), black (21.7), Hispanic (22.0) Source: CDC YRBS")
83
U.S. Youth Participation in Sufficient Vigorous (V) Physical Activity Levels by Grade and Sex
Source: CDC YRBS 2003

84
U.S. Youth Physical Activity Levels by Age and Sex: Vigorous (V) and Moderate (M)
Source: CDC YRBS

85
Trends in Prevalence of Physical Activity among U.S. Youth: 1991-2003
* * 1.) Slight drop in vigorous physical activity, still around a third who do not get enough vigorous activity (66% in 91 to 63% in 2003). 2.) Slight increase in participation in strengthening exercises that was statistically significant, from 48% in 1991 to 52% in 2003. 3.) Decrease in daily participation in Physical Education classes, with biggest drop occurring between 1991 and 1994 (42% in 91 to 25% in ’95) Daily participation in high school physical education classes dropped from 42% in 1991 to around 28% in 2003. *Significant changes over time Source: CDC YRBS
 Slight drop in vigorous physical activity, still around a third who do not get enough vigorous activity (66% in 91 to 63% in 2003). 2.) Slight increase in participation in strengthening exercises that was statistically significant, from 48% in 1991 to 52% in ) Decrease in daily participation in Physical Education classes, with biggest drop occurring between 1991 and 1994 (42% in 91 to 25% in ’95) Daily participation in high school physical education classes dropped from 42% in 1991 to around 28% in *Significant changes over time. Source: CDC YRBS.")
86
Reported Physical Activities from Mid to Late Adolescence - Boys
Physical Activity % Participants- 1990 % Participants-1993 Basketball 66 59 Football 42 Bicycling 58 3 Baseball 55 29 Street hockey 30 Weight lifting 31 40 Aaron et al., 2002, Arch Pediatr Adolesc Med

87
Reported Physical Activities from Mid to Late Adolescence - Girls
Physical Activity % Participants- 1990 % Participants-1993 Bicycling 52 2 Softball 36 22 Basketball 34 18 Running 29 28 Aerobics 20 23 Bowling 19 10 Aaron et al., 2002, Arch Pediatr Adolesc Med

88
Prevalence of Obesity by Daily Hours of TV Watching U. S
Prevalence of Obesity by Daily Hours of TV Watching U.S. children aged 8 – 16, Crespo et al., Arch Ped Adol Med ;155:

89
Physical Activity & Youth
Prevalence of Physical Activity & Inactivity More than a third of young people in grades 9-12 do not engage in sufficient vigorous physical activity. About 14% of young people report no recent physical activity. Only 19 percent of high school students are physically active for 20 minutes or more, five days a week, during physical education classes. 38% of youth watch ≥3 hours of TV on a school day Gender Physical activity is higher among male adolescents, and inactivity is more common among females than males (14% vs. 7%). Ethnicity Physical activity levels differ by race/ethnicity, with white adolescents appearing to engage in more physical activity than African American and Hispanic adolescents Source: CDC
. Ethnicity. Physical activity levels differ by race/ethnicity, with white adolescents appearing to engage in more physical activity than African American and Hispanic adolescents. Source: CDC.")
90
Physical Activity & Youth
Age Participation in all types of physical activity declines strikingly as grade in school and age increases. Trends: Slight drop in vigorous physical activity, with around a third who do not get enough vigorous activity (66% in ‘91 to 63% in 2003). Slight increase in participation in strengthening exercises that was statistically significant, from 48% in 1991 to 52% in 2003. Daily participation in high school physical education classes dropped from 42% in 1991 to around 28% in 2003. Source: CDC
. Slight increase in participation in strengthening exercises that was statistically significant, from 48% in 1991 to 52% in Daily participation in high school physical education classes dropped from 42% in 1991 to around 28% in Source: CDC.")
Similar presentations