Download presentation
Presentation is loading. Please wait.

1
Foot Solo Wednesday May 25, 2011 Vincent Carter 132974

2
Table of Contents Slide 3,4 Personal information Slide 5 Compare to Napa County Slide 6-9 Projections Slide 10,11 Effect on Temperature Slide 12 Ways to conserve Slide 13 Sources

3
This is me. Basic Information 39 Year old Male with a family of 5 420 SQFT Garden Backyard and front yard sprinklers Wear C-Pac machine at night with heavy covers and the ceiling fan on. We do 6 loads of laundry a week Swimming pool and hot tub Vincent F. Carter

4
Family Monthly Big Heavy Foot Print. Water = 11,518 Gallons 922Kwh Electricity 34.6 Therms Natural Gas.35 Therms Propane Transportation Pilot 19-23 MPG Accord 21-25 MPG Civic 24-28 MPG Honda Pilot 2005 500 miles Honda Accord 1998 1200 miles Honda Civic 2002 480 miles

5
How we compare Water usage source: American Canyon Water Department My House 27,643 gallons Napa County 64,900 gallons Average a year per person www.pge.comwww.pge.com personal usage 1.15 tons of CO2 http://www.epa.gov/oms/climate/420f05 001.htm 2.56 tons of CO2 http://www.terrapass.com/ca rbon-footprint- calculator/action 1.70 tons of CO2 http://www.terrapass.com/carbon- footprint-calculator/action 1.89 tons of CO2 http://www.aglcarboncalcul ator.com.au / 2.99 tons of CO2 http://www.epa.gov/climatechange/emi ssions/ind_calculator2.html#c=transportat ion&p=reduceOnTheRoad&m=calc_curre ntEmissions 2.05 tons of CO2 http://www.safeclimate.net/ calculator/ind_calc_results.p hp 1.4 tons of CO2 www.aglcarboncalculator.com.au/ 1.51 tons of CO2 House Transportation Average 1.81 tons of CO2 Average 2.00 tons of CO2 www.ci.calistoga.ca.us/Mod ules/ShowDocument.aspx?d ocumentid=4680 1.46 tons of CO2 http://www.climateprotectioncampaign.o rg/ccap/pdf/2.Updated_GHG_Inventory. pdf 4.72 tons of CO2

6
Napa County Impact CO2 levels by Capita in tons

7
Projections for California

8
United States Projection

9
World Projection

11
Source http://www.sciencedaily.com/releases/2009/06/090610154453.htm

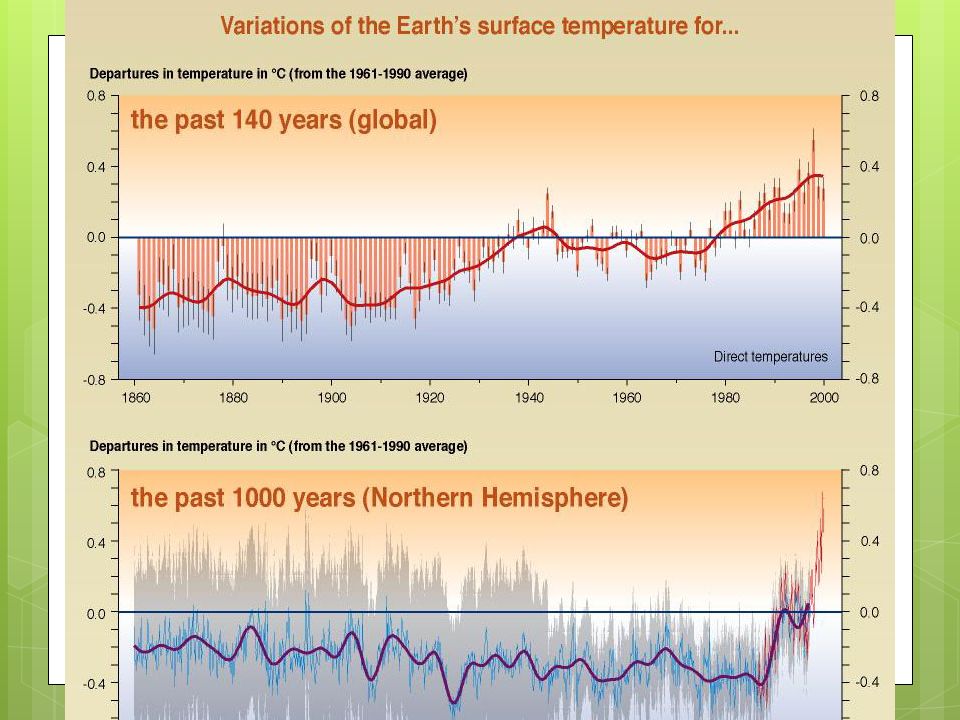
12
Ways to reduce CO2 emission Home Transportation During Winter time lower thermostat by 8 degrees. During Summertime raise the thermostat 8 degrees. Use cold water for washing clothes. Replace light bulbs with CFL energy star light bulbs. Replace appliances with energy star appliances. Insulate your house. Use tankless water heaters Use Dishwasher instead of hand washing. Carpool or use public transportation when possible. Buy hybrid vehicles. Check tire inflation regularly. Keep vehicle well maintained. Use bicycle or walk short distances. Roll down window during Summertime or dress warmer during Wintertime instead of A/C. Use vehicle size appropriate for task.

13
Cited Sources: AGL. AGL Carbon Calculator. n.d. 19 May 2011. California Green Innoviation Index 2009. August 2009. 21 May 2011. Intergovernmental Panel on Climate Change. 2006. 23 May 2011. Napa Carbon Foot Print. n.d. 22 May 2011. Napa County Greenhouse Gases Baseline. 29 July 2009. 23 May 2011. napa countywide communityclimate plan. October 2009. 21 May 2011. Pacific Gas and Electric. 2011. 20 May 2011. Science Daily. Carbon Emissions Linked To Global Warming In Simple Linear Relationship. 11 June 2009. 21 May 2011. terrapass. Take action to reduce your carbon footprint. 2011. 19 May 2011. United States Environmental Agency. Overview: Pollutants and Programs. February 2005. 21 May 2011. United States Environmental Protection Agency. Climate Change Greenhouse Gas Emissions. n.d. 19 May 2011.

Similar presentations


 ONE with SAI PILGRIMAGE 2010.>")


, Jacqueline Covarrubias ( )>")


