Download presentation
Presentation is loading. Please wait.

2
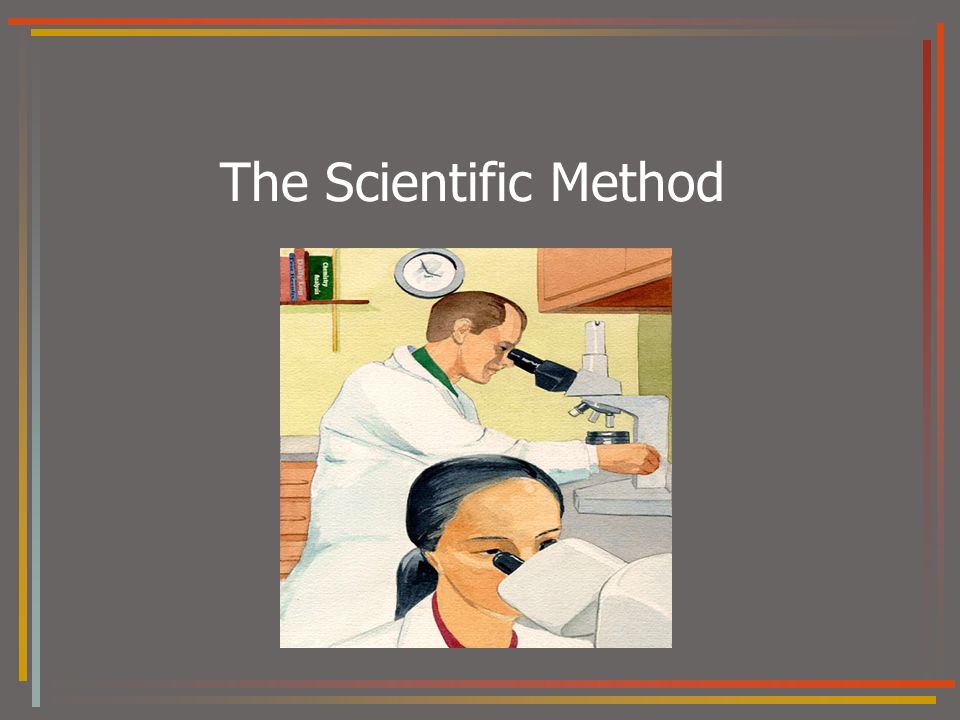
The Scientific Method

3
I. The scientific method is an orderly way to solve problems Five steps: –1. Observations/Asking a question –2. hypothesis –3. Experiment –4. Recording results –5. Discussion & Conclusion

4
A. Asking a question -Based on identification of a problem -Scientists make OBJECTIVE observations of the natural world in order to identify the problem. -Observations are followed by inferences, logical interpretation based on prior knowledge and experience.

5
B. Hypothesis – possible explanation for a set of observations Making an “educated guess” that is testable. Deductive hypothesis: “if”…”then” statement. Inductive hypothesis: most common type; gut feeling.

6
C. Designing an Experiment: Controlled experiment – only one variable, or factor, is changed at a time. All other factors are called constants and are exactly the same for all test groups. Independent variable – the thing that is changed or manipulated. Dependent variable – the response to the change that was made. (What you measure)
.")
7
Controlled experiment Based on a comparison of a control group and an experimental group. Control group – the “norm” – you don’t do anything to this group. It should represent the normal situation, and be a standard of comparison. Experimental Groups – these are the groups that you change or manipulate to test a certain variable.

8
Example: You are testing a certain drug was effective in lowering blood pressure: All participants in the study should be similar in age/gender/condition to eliminate these factors from affecting the results. You only want to test ONE FACTOR or VARIABLE at a time. Control group: People who receive a PLACEBO (or a pill that doesn’t do anything). These people have not received treatment and can be compared to the ones who do. Experimental Group: People who receive the blood pressure medicine.
. These people have not received treatment and can be compared to the ones who do. Experimental Group: People who receive the blood pressure medicine..")
9
D. Recording data –Qualitative data – descriptive info, such as color, texture, etc. –Quantitative data – numerical info –In the recording section of a scientific paper, the scientist simply RECORDS the data, they do not attempt to analyze or explain it. –Create graphs and tables to illustrate your data

10
E. Discussion & Conclusion *Explain the graphs and tables in paragraph form. –Refer back to your graphs in your written description. Ex. As seen in figure 1.1, the amount of oxygen……. *This is where you interpret your data, and tell us what it means.

11
Drawing Conclusions -explain your findings – whether you “support” or “reject” your hypothesis

12
F. Ideal Experiments Should be repeatable. Scientists publish at the end of the process, so that others may share their knowledge and verify their results.

13
G. Theories vs. Laws Theory –Attempts to explain WHY something happens –Applies to a well-tested explanation –Unifies a broad range of observations –Is subject to change - Ex.: atomic theory Law –Always true –Explains WHAT happens –Ex. Law of gravity

14
II. Real-life example: 1976 – outbreak of disease in Zaire, Africa Disease was very contagious and deadly Victims had severe headaches, fever, bloody diarrhea, and vomiting.

15
In the last stages of the disease: Victim’s internal organs bled uncontrolably and blood leaked through the nose, ears, and even skin. Death from shock and cardiovascular shock followed rapidly.

16
What happened? Teams of scientists from the Centers for Disease Control were sent to Zaire to investigate what seemed to be a new disease.

17
Centers for Disease Control (CDC) Agency for the United States government responsible for monitoring diseases. The CDC is also the agency in charge of dealing with bioterrorism.

18
A. OBSERVATION All scientific understanding of the world starts with an observation or question about something unusual or unexplained. For example: People are dying from a disease that no one has seen before.

19
Here are some of the initial data/observations the CDC recorded: Outbreak had caused nearly 300 deaths Death followed within a week of 1 st symptom 80 to 90% of people who become infected died. Photographed a virus in the blood of victims

20
Observations always lead to the formation of a question: What is this new disease? How is it transmitted? What is the disease causing agent??? (I.e. – is it a bacteria, virus, parasite…)
.")
21
B. CDC hypothesis: CDC scientists believed that a virus they had photographed in the blood of victims was the organism that caused the disease.

22
To test a hypothesis, scientists make a prediction that logically follows from the hypothesis: For example: If the virus were the true disease-causing agent, then introducing the virus into healthy tissue would cause cell death like that found in victims of the disease.

23
C. EBOLA EXPERIMENT Liver cells from a monkey were placed in a test tube (monkeys are genetically similar to humans) Test tubes in the control group (the group that mimics NORMAL environment) were left alone. Blood containing the virus was placed in the experimental test tubes.
 Test tubes in the control group (the group that mimics NORMAL environment) were left alone. Blood containing the virus was placed in the experimental test tubes..")
24
Independent variable – the addition of blood to the monkey cells. Dependent variable – the health of the cells.

25
D. Collecting data: 11 days after addition of virus blood – the experimental group cells were dead. Control group was fine. Liquid from the experimental group could be passed to healthy cells, resulting in rapid death.

26
E. Conclusion: The virus photographed was the infectious agent. (caused the disease) In a conclusion you admit the failings of your experiment: –for example: scientists still don’t know the animal that harbors the virus in the wild – or how the virus is spread to humans.
 In a conclusion you admit the failings of your experiment: –for example: scientists still don’t know the animal that harbors the virus in the wild – or how the virus is spread to humans..")
27
Scientists also don’t know how EBOLA virus is spread – –They know it requires close contact –Don’t know if the person has to have a break in the skin to get the virus.

28
Hemorrhagic = bleeding

29
The scientific method is a cycle: Observation question hypothesis prediction experiment Collect data Analyze data conclude (revise hypothesis if necessary.)
")
Similar presentations


 Collect information.>")