Download presentation
Presentation is loading. Please wait.

1
3.5 Unemployment

2
Unemployment Full Employment Equilibrium on the aggregate labor market

3
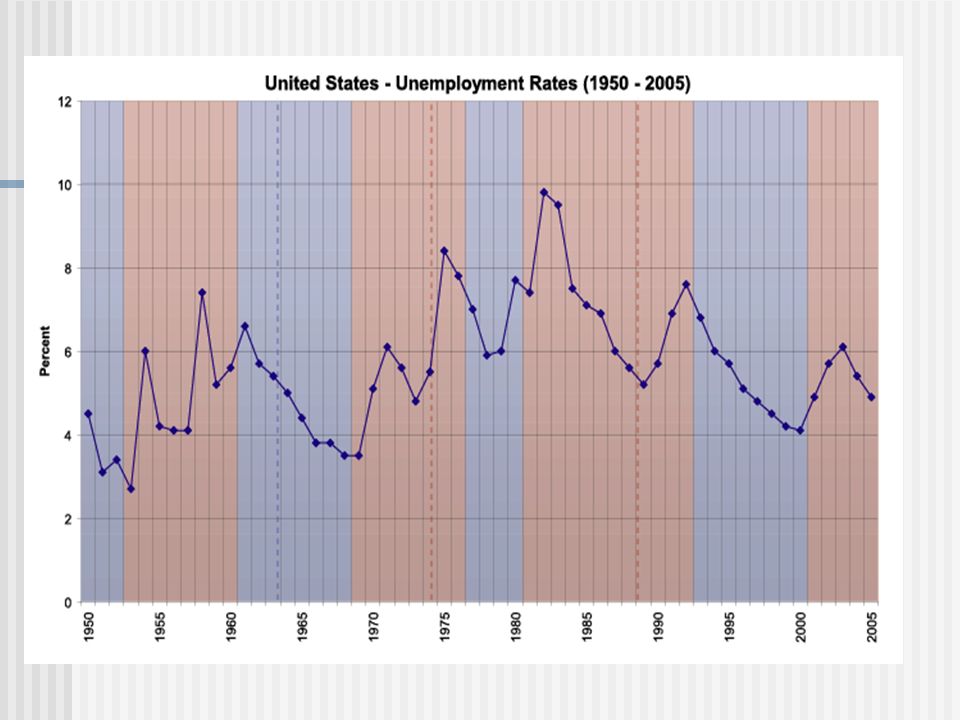
What rate is generally considered to be full-employment in America?

5
Underemployment People cannot find full-time work. Unemployment Rate Formula: Unemployed/Labor Force = %

6
2006 Figures Around 5% 90 Vietnam5.50 90 Denmark5.50 90 Romania5.50 91 Lithuania5.30 92 Australia5.20 93 United States5.10 93 Austria5.10 94 Burma5.00 95 Luxembourg4.90 96 Brunei4.80 97 United Kingdom4.70 98 Saint Kitts and Nevis4.50 99 Japan4.30 100 Taiwan4.20 100 Ireland4.20 100 Norway4.20 100 ChinaVietnamDenmarkRomaniaLithuania AustraliaUnited StatesAustriaBurma LuxembourgBruneiUnited KingdomSaint Kitts and NevisJapanTaiwanIreland NorwayChina

7
Colombia 10.20 60 Spain10.10 61 Turks and Caicos Islands10.00 Turkey10.00 61 Greenland10.00 61 Egypt10.00 61 France10.00 62 India9.90 62 Brazil9.90 63 Saint Pierre and Miquelon9.80 63 Slovenia9.80 64 EcuadorSpainTurks and Caicos IslandsTurkey GreenlandEgyptFranceIndia BrazilSaint Pierre and MiquelonSlovenia Ecuador

8
Weaknesses of Unemployment Measures Definitional Problems Accounting Problems Solution: Standardized Measure International Labour Organization (ILO) Used by Organisation of Economic Cooperation and Development (OECD) www.oecd.org
 Used by Organisation of Economic Cooperation and Development (OECD)")
9
Costs of Unemployment Loss of output Lost tax base Increased Transfer Payments Opportunity costs (roads vs. unemployment benefits) Tax Increases Barriers to entry Deskilling of workforce
 Tax Increases Barriers to entry Deskilling of workforce.")
10
Social Costs Dignity vs. Dependence Self-image Crime, Drug Abuse, Physical abuse Health Depression Stress Mental Health

11
Types of Unemployment Structural(mismatch between skills and demand of economy) Regional Industries specific to a region Sectoral Segments suffer temporary or permanent decline Technological Technology replaces workers Frictional Short term/ during job search Seasonal
 Regional Industries specific to a region Sectoral Segments suffer temporary or permanent decline Technological Technology replaces workers Frictional Short term/ during job search Seasonal")
12
Natural Rate of Unemployment Some people voluntarily reject the real wage rate (equilibrium) There is always some unemployment Pg. 418

13
Cyclical/Demand Deficient U Keynesian Unemployment Business Cycle affects Unemployment Involuntary unemployment Pg. 419 ADL shifts left Distance ADL1 to ADL2 Why don’t wages clear? How are AD and ADL correlated? See pg. 420

14
Downward Sticky Supply Curve Pg. 420 Same effect as minimum wage

15
Real Wage Unemployment Classical View Disequilibrium Unemployment Unemploy exceeds natural rate Doesn’t clear to real wage (equil) Voluntary + Involuntary Unemployment Diagrams pg. 421 Why doesn’t in clear? Minimum wage legislation Unions Social Benefits (no incentive to accept lower wages).
..")
16
Measures to Deal With Unemployment Interventionist Increase demand for labor through fiscal and monetary stimulation of AD Demand Management (Keynes) Increase ADL by increasing AD in economy Shift in ADL right = Full employment Diagram 422
 Increase ADL by increasing AD in economy Shift in ADL right = Full employment Diagram 422")
17
Supply Side Intervention Govt. intervention in factor markets to enhance: Attractiveness of labor Availability of labor (ie. Supply of labor) Secondary affect = increased DL How? Training and education incentives Increase Skills Job mobility Decrease search costs for employers and labor
 Secondary affect = increased DL How. Training and education incentives Increase Skills Job mobility Decrease search costs for employers and labor.")
18
Market Solutions pg. 423- 425 Removing market imperfections Decrease union power Lower minimum wage Lower taxes on labor

19
Decreasing Natural Rate of Unemployment Shift ASL right How? Incentives to work Lower social benefits Lower income taxes Increase labor flexibility Retraining and Eduction Reduce time between jobs

20
Critics of market policies Social Inequality Marginal Tax decreases don’t affect ASL Voluntary is often involuntary

Similar presentations


 when the economy is at full employment, there is still some amount of unemployment. (recall the definition of.>")


