Download presentation
Presentation is loading. Please wait.

1
All participants are on mute.
Rigor and Relevance Al Fabrizio, Assistant Principal for Curriculum Jensen Beach High School, Florida To hear this webinar you will need to choose your audio mode. Go to the control panel in the upper right corner of your screen and click the button of how you will be listening. Your choices: Use telephone Use mic & speakers If using mic & speakers make sure your volume is turned up so you can hear If using the telephone Dial: Access Code: Audio PIN: unique PIN shown in audio control panel on screen Technical difficulties? Contact (518) All participants are on mute.
 All participants are on mute.")
2
Webinar Guidelines All participants are on mute during the entire webinar. Presentation portion will be 45 minutes Questions and Answers portion will be 15 minutes To ask a question type it in the question control panel in the upper right corner of your screen. Content questions will be answered in the order they were received at the end of the webinar presentation. We will send you a follow up with the PowerPoint presentation and helpful resources

3
International Center for Leadership in Education
Rigor / Relevance in the Classroom: What It Looks Like, How to Create It Al Fabrizio International Center for Leadership in Education Assistant Principal

4
What are you preparing our students for?
Work High School/College Life

5
The primary aim of education is not to enable students to do well in school, but to help them do well in the lives they lead outside of school.

6
Poll Higher Level of Learning

7
Which of the following is the highest level of learning?
Read a description of a science experiment and list the necessary materials to perform the experiment. Locate and read a current article on biotechnology, summarize the innovation and benefits to humans. Read and analyze three original newspaper articles from WW II and identify reasons for public opposition to US entry into the war. Write directions on how to connect new television to cable and DVD recorder.

8
Rapidly Improving Schools Characteristics
High Expectations and Relationships Data-driven Decisions Accountability Articulated Curriculum Rigorous and Relevant Instruction Personalized Learning Professional Learning Communities Partnerships School Climate Leadership

10
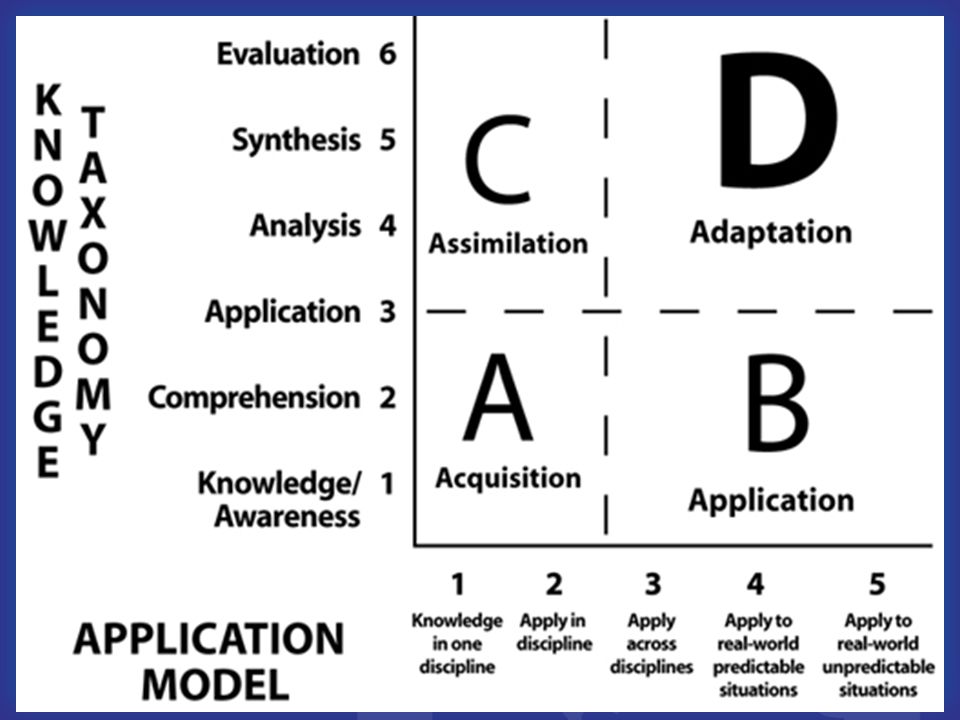
Rigor/Relevance Framework
Opening Question C D Read and analyze three original newspaper articles from WW II and identify reasons for public opposition to US entry into the war. Write directions on how to connect new television to cable and DVD recorder. RIGOR High A B Read a description of a science experiment and list the necessary materials to perform the experiment. Locate and read a current article on biotechnology, summarize the innovation and benefits to humans. Low Low High RELEVANCE

11
Successful Curriculum Reform
Why Do We Need to Change Schools? What Needs to Be Done? How Do We Do It?

12
???? Why Rigor and Relevance ????
Changing Nature of Work - Technology Global Competition - It’s a Flat World Conceptual Age - Requires Whole Brain Thinkers Youth Have Changed - Digital Natives Increased Accountability for Learning Multiple Achievement Gaps Poor Student Engagement Overloaded Curriculum

13
An overloaded curriculum

14
When society changes – so too must education if it is to remain viable!

15
Successful Curriculum Reform
Why Do We Need to Change Schools? What Needs to Be Done? How Do We Do It?

16
ICLE Philosophy Rigor Relevance Relationships All Students

17
ICLE Philosophy Relationships Relevance Rigor All Students

18
Relevance My only skill is taking tests.

19
Rigor/Relevance Framework
D C High R I GOR A B Low Low High RELEVANCE

20
Improvement of Teaching and Learning
Using R/R Framework Design Assessments Plan Instruction Select Strategies Improvement of Teaching and Learning 20

21
Rigor/Relevance Framework
6 Knowledge D C 5 4 3 A B 2 1 Application 1 2 3 4 5

22
Knowledge Taxonomy 6. Evaluation 5. Synthesis 4. Analysis
3. Application 2. Comprehension 1. Recall Knowledge

23
t

24
Knowledge Taxonomy Basic Nutrition
1 Label food by nutritional groups (Knowledge) 2 Explain nutritional value of individual foods (Comprehension) 3 Use nutritional guidelines in planning meals (Application) 4 Examine success in achieving nutritional goal (Analysis) 5 Develop personal nutrition goals (Synthesis) 6 Appraise results of personal eating habits over time (Evaluation)
 2 Explain nutritional value of individual foods (Comprehension) 3 Use nutritional guidelines in planning meals (Application) 4 Examine success in achieving nutritional goal (Analysis) 5 Develop personal nutrition goals (Synthesis) 6 Appraise results of personal eating habits over time (Evaluation)")
25
Rigor is… Rigor is not… Scaffolding thinking More or harder worksheets
Planning for thinking Assessing thinking about content Recognizing the level of thinking students demonstrate Managing the teaching/ learning level for the desired thinking level More or harder worksheets AP or honors courses The higher level book in reading More work More homework

26
Application Model 5 Application to real-world unpredictable situations
4 Application to real-world predictable situations 3 Application across disciplines 2 Application within discipline 1 Knowledge of one discipline

27
Application Model Basic Nutrition 1 Label food by nutrition groups
2 Rank foods by nutritional value 3 Make cost comparison of foods considering nutritional value 4 Develop nutritional plan for a health problem affected by food 5 Devise a sound nutritional plan for a group of 3 year-olds who are “picky” eaters

28
Rigor/Relevance Framework
Knowledge Application 1. Recall Knowledge 2. Comprehension 3. Application 4. Analysis 5. Synthesis 6. Evaluation Low High 1. Knowledge of one discipline 2. Application within discipline 3. Application across disciplines 4. Application to real world predictable situations 5. Application to real world unpredictable situations

29
Four Quadrants of Learning
Assimilation C Adaptation D C D Complex Analytical Challenging Real World High R I GOR Acquisition A Application B A B Routine Memorization Practical Hands On Low Low High 16 RELEVANCE

30
Quadrant D Lesson Benefits
INCREASE UNDERSTANDING MAXIMIZE TIME ON TASK INCREASE RETENTION AND REDUCE RE-TEACHING INCREASE STUDENT INTEREST AND ENGAGEMENT

31
What does student engagement look like?

35
Quadrant A Verbs Products name label define select identify list
memorize recite locate record definition worksheet list quiz test workbook true-false reproduction recitation

36
D C B A High School Examples 6 5 4 3 2 1 1 2 3 4 5
Obtain historical data about local weather to predict the chance of snow, rain, or sun during year. Test consumer products and illustrate the data graphically. Plan a large school event and calculate resources (food, decorations, etc.) you need to organize and hold this event. Make a scale drawing of the classroom on grid paper, each group using a different scale. Analyze the graphs of the perimeters and areas of squares having different-length sides. Determine the largest rectangular area for a fixed perimeter. Identify coordinates for ordered pairs that satisfy an algebraic relation or function. Determine and justify the similarity or congruence for two geometric shapes. D English: Select books and read to younger children. Math: Provide examples to illustrate properties of real numbers. Science: Demonstrate modulation of sound waves using computer animation. Social Studies: Recognize why international trade takes place and the role of exchange rates. C 5 4 3 Calculate percentages of advertising in a newspaper. Tour the school building and identify examples of parallel and perpendicular lines, planes, and angles. Determine the median and mode of real data displayed in a histogram Organize and display collected data, using appropriate tables, charts, or graphs. 2 A B 1 1 2 3 4 5
 you need to organize and hold this event. Make a scale drawing of the classroom on grid paper, each group using a different scale. Analyze the graphs of the perimeters and areas of squares having different-length sides. Determine the largest rectangular area for a fixed perimeter. Identify coordinates for ordered pairs that satisfy an algebraic relation or function. Determine and justify the similarity or congruence for two geometric shapes. D. English: Select books and read to younger children. Math: Provide examples to illustrate properties of real numbers. Science: Demonstrate modulation of sound waves using computer animation. Social Studies: Recognize why international trade takes place and the role of exchange rates. C Calculate percentages of advertising in a newspaper. Tour the school building and identify examples of parallel and perpendicular lines, planes, and angles. Determine the median and mode of real data displayed in a histogram. Organize and display collected data, using appropriate tables, charts, or graphs. 2. A. B")
37
D C B A Middle School Examples 6 5 4 3 2 1 1 2 3 4 5
Obtain historical data about local weather to predict the chance of snow, rain, or sun during year. Test consumer products and illustrate the data graphically. Plan a large school event and calculate resources (food, decorations, etc.) you need to organize and hold this event. Make a scale drawing of the classroom on grid paper, each group using a different scale. Analyze the graphs of the perimeters and areas of squares having different-length sides. Determine the largest rectangular area for a fixed perimeter. Identify coordinates for ordered pairs that satisfy an algebraic relation or function. Determine and justify the similarity or congruence for two geometric shapes. D English: Use library reference tools. Math: Calculate volume of regular solids. Science: Observe wave properties of light using soap bubbles. Social Studies: Discover characteristics of society in earlier decade by reading historical documents, such as wills and letters. C 5 4 3 Calculate percentages of advertising in a newspaper. Tour the school building and identify examples of parallel and perpendicular lines, planes, and angles. Determine the median and mode of real data displayed in a histogram Organize and display collected data, using appropriate tables, charts, or graphs. 2 A B 1 1 2 3 4 5
 you need to organize and hold this event. Make a scale drawing of the classroom on grid paper, each group using a different scale. Analyze the graphs of the perimeters and areas of squares having different-length sides. Determine the largest rectangular area for a fixed perimeter. Identify coordinates for ordered pairs that satisfy an algebraic relation or function. Determine and justify the similarity or congruence for two geometric shapes. D. English: Use library reference tools. Math: Calculate volume of regular solids. Science: Observe wave properties of light using soap bubbles. Social Studies: Discover characteristics of society in earlier decade by reading historical documents, such as wills and letters. C Calculate percentages of advertising in a newspaper. Tour the school building and identify examples of parallel and perpendicular lines, planes, and angles. Determine the median and mode of real data displayed in a histogram. Organize and display collected data, using appropriate tables, charts, or graphs. 2. A. B")
38
D C B A Elementary Examples 6 5 4 3 2 1 1 2 3 4 5
Obtain historical data about local weather to predict the chance of snow, rain, or sun during year. Test consumer products and illustrate the data graphically. Plan a large school event and calculate resources (food, decorations, etc.) you need to organize and hold this event. Make a scale drawing of the classroom on grid paper, each group using a different scale. Analyze the graphs of the perimeters and areas of squares having different-length sides. Determine the largest rectangular area for a fixed perimeter. Identify coordinates for ordered pairs that satisfy an algebraic relation or function. Determine and justify the similarity or congruence for two geometric shapes. D Science: Memorize names of planets in solar system. Math: Find the lines of symmetry in letters of the alphabet and numerals. English: Create a list of commonly misspelled words. Social Studies: Read a biography of a Native American. C 5 4 3 Calculate percentages of advertising in a newspaper. Tour the school building and identify examples of parallel and perpendicular lines, planes, and angles. Determine the median and mode of real data displayed in a histogram Organize and display collected data, using appropriate tables, charts, or graphs. 2 A B 1 1 2 3 4 5
 you need to organize and hold this event. Make a scale drawing of the classroom on grid paper, each group using a different scale. Analyze the graphs of the perimeters and areas of squares having different-length sides. Determine the largest rectangular area for a fixed perimeter. Identify coordinates for ordered pairs that satisfy an algebraic relation or function. Determine and justify the similarity or congruence for two geometric shapes. D. Science: Memorize names of planets in solar system. Math: Find the lines of symmetry in letters of the alphabet and numerals. English: Create a list of commonly misspelled words. Social Studies: Read a biography of a Native American. C Calculate percentages of advertising in a newspaper. Tour the school building and identify examples of parallel and perpendicular lines, planes, and angles. Determine the median and mode of real data displayed in a histogram. Organize and display collected data, using appropriate tables, charts, or graphs. 2. A. B")
39
Quadrant B Verbs Products scrapbook summary interpretation collection
apply sequence demonstrate interview construct solve calculate dramatize interpret illustrate scrapbook summary interpretation collection annotation explanation solution demonstration outline

40
D C B A High School Examples 6 5 4 3 2 1 1 2 3 4 5
Obtain historical data about local weather to predict the chance of snow, rain, or sun during year. Test consumer products and illustrate the data graphically. Plan a large school event and calculate resources (food, decorations, etc.) you need to organize and hold this event. Make a scale drawing of the classroom on grid paper, each group using a different scale. Analyze the graphs of the perimeters and areas of squares having different-length sides. Determine the largest rectangular area for a fixed perimeter. Identify coordinates for ordered pairs that satisfy an algebraic relation or function. Determine and justify the similarity or congruence for two geometric shapes. D C English: Participate in a debate on a current political issue. Math: Calculate frequency of vibration of various piano strings. Science: Apply Laws of Gases to design gas storage containers. Social Studies: Locate and interpret current and historical economic data, i.e., GDP, CPI, employment. 5 4 3 Express probabilities as fractions, percents, or decimals. Classify triangles according to angle size and/or length of sides. Calculate volume of simple three- dimensional shapes. Given the coordinates of a quadrilateral, plot the quadrilateral on a grid. 2 A B 1 1 2 3 4 5
 you need to organize and hold this event. Make a scale drawing of the classroom on grid paper, each group using a different scale. Analyze the graphs of the perimeters and areas of squares having different-length sides. Determine the largest rectangular area for a fixed perimeter. Identify coordinates for ordered pairs that satisfy an algebraic relation or function. Determine and justify the similarity or congruence for two geometric shapes. D. C. English: Participate in a debate on a current political issue. Math: Calculate frequency of vibration of various piano strings. Science: Apply Laws of Gases to design gas storage containers. Social Studies: Locate and interpret current and historical economic data, i.e., GDP, CPI, employment Express probabilities as fractions, percents, or decimals. Classify triangles according to angle size and/or length of sides. Calculate volume of simple three- dimensional shapes. Given the coordinates of a quadrilateral, plot the quadrilateral on a grid. 2. A. B")
41
D C B A Middle School Examples 6 5 4 3 2 1 1 2 3 4 5
Obtain historical data about local weather to predict the chance of snow, rain, or sun during year. Test consumer products and illustrate the data graphically. Plan a large school event and calculate resources (food, decorations, etc.) you need to organize and hold this event. Make a scale drawing of the classroom on grid paper, each group using a different scale. Analyze the graphs of the perimeters and areas of squares having different-length sides. Determine the largest rectangular area for a fixed perimeter. Identify coordinates for ordered pairs that satisfy an algebraic relation or function. Determine and justify the similarity or congruence for two geometric shapes. D English: Conduct a meeting using parliamentary procedures. Math: Calculate percents of daily requirements met through a typical school lunch. Science: Build a simple electrical circuit to illustrate digital principle of computers. Social Studies: Research what items cost in other countries and use exchange rates to relate to US prices. C 5 4 3 Calculate percentages of advertising in a newspaper. Tour the school building and identify examples of parallel and perpendicular lines, planes, and angles. Determine the median and mode of real data displayed in a histogram Organize and display collected data, using appropriate tables, charts, or graphs. 2 A B 1 1 2 3 4 5
 you need to organize and hold this event. Make a scale drawing of the classroom on grid paper, each group using a different scale. Analyze the graphs of the perimeters and areas of squares having different-length sides. Determine the largest rectangular area for a fixed perimeter. Identify coordinates for ordered pairs that satisfy an algebraic relation or function. Determine and justify the similarity or congruence for two geometric shapes. D. English: Conduct a meeting using parliamentary procedures. Math: Calculate percents of daily requirements met through a typical school lunch. Science: Build a simple electrical circuit to illustrate digital principle of computers. Social Studies: Research what items cost in other countries and use exchange rates to relate to US prices. C Calculate percentages of advertising in a newspaper. Tour the school building and identify examples of parallel and perpendicular lines, planes, and angles. Determine the median and mode of real data displayed in a histogram. Organize and display collected data, using appropriate tables, charts, or graphs. 2. A. B")
42
D C B A Elementary Examples 6 5 4 3 2 1 1 2 3 4 5
Obtain historical data about local weather to predict the chance of snow, rain, or sun during year. Test consumer products and illustrate the data graphically. Plan a large school event and calculate resources (food, decorations, etc.) you need to organize and hold this event. Make a scale drawing of the classroom on grid paper, each group using a different scale. Analyze the graphs of the perimeters and areas of squares having different-length sides. Determine the largest rectangular area for a fixed perimeter. Identify coordinates for ordered pairs that satisfy an algebraic relation or function. Determine and justify the similarity or congruence for two geometric shapes. Science: Develop a food list for a space trip. Math: Sort quantities to discover fractions of the whole. English: Present a story through a computer graphics application. Social Studies: Describe the geographic and climactic characteristics of your local community. D C 5 4 3 Express probabilities as fractions, percents, or decimals. Classify triangles according to angle size and/or length of sides. Calculate volume of simple three- dimensional shapes. Given the coordinates of a quadrilateral, plot the quadrilateral on a grid. 2 A B 1 1 2 3 4 5
 you need to organize and hold this event. Make a scale drawing of the classroom on grid paper, each group using a different scale. Analyze the graphs of the perimeters and areas of squares having different-length sides. Determine the largest rectangular area for a fixed perimeter. Identify coordinates for ordered pairs that satisfy an algebraic relation or function. Determine and justify the similarity or congruence for two geometric shapes. Science: Develop a food list for a space trip. Math: Sort quantities to discover fractions of the whole. English: Present a story through a computer graphics application. Social Studies: Describe the geographic and climactic characteristics of your local community. D. C Express probabilities as fractions, percents, or decimals. Classify triangles according to angle size and/or length of sides. Calculate volume of simple three- dimensional shapes. Given the coordinates of a quadrilateral, plot the quadrilateral on a grid. 2. A. B")
43
Quadrant C Products Verbs essay abstract blueprint inventory report
plan chart questionnaire classification diagram discussion collection annotation sequence annotate examine report criticize paraphrase calculate expand summarize classify diagram

44
D C B A High School Examples 6 5 4 3 2 1 1 2 3 4 5
Obtain historical data about local weather to predict the chance of snow, rain, or sun during year. Test consumer products and illustrate the data graphically. Plan a large school event and calculate resources (food, decorations, etc.) you need to organize and hold this event. Make a scale drawing of the classroom on grid paper, each group using a different scale. D English: Discuss role of media in a democracy. Math: Construct truth tables as a shorthand method for discussing logical sentences. Science: Write test questions to illustrate understanding of empirical gas laws. Social Studies: Answer data-based questions using copies of historical documents. C 5 4 3 Calculate percentages of advertising in a newspaper. Tour the school building and identify examples of parallel and perpendicular lines, planes, and angles. Determine the median and mode of real data displayed in a histogram Organize and display collected data, using appropriate tables, charts, or graphs. Express probabilities as fractions, percents, or decimals. Classify triangles according to angle size and/or length of sides. Calculate volume of simple three- dimensional shapes. Given the coordinates of a quadrilateral, plot the quadrilateral on a grid. 2 A B 1 1 2 3 4 5
 you need to organize and hold this event. Make a scale drawing of the classroom on grid paper, each group using a different scale. D. English: Discuss role of media in a democracy. Math: Construct truth tables as a shorthand method for discussing logical sentences. Science: Write test questions to illustrate understanding of empirical gas laws. Social Studies: Answer data-based questions using copies of historical documents. C Calculate percentages of advertising in a newspaper. Tour the school building and identify examples of parallel and perpendicular lines, planes, and angles. Determine the median and mode of real data displayed in a histogram. Organize and display collected data, using appropriate tables, charts, or graphs. Express probabilities as fractions, percents, or decimals. Classify triangles according to angle size and/or length of sides. Calculate volume of simple three- dimensional shapes. Given the coordinates of a quadrilateral, plot the quadrilateral on a grid. 2. A. B")
45
D C B A Middle School Examples 6 5 4 3 2 1 1 2 3 4 5
Obtain historical data about local weather to predict the chance of snow, rain, or sun during year. Test consumer products and illustrate the data graphically. Plan a large school event and calculate resources (food, decorations, etc.) you need to organize and hold this event. Make a scale drawing of the classroom on grid paper, each group using a different scale. Analyze the graphs of the perimeters and areas of squares having different-length sides. Determine the largest rectangular area for a fixed perimeter. Identify coordinates for ordered pairs that satisfy an algebraic relation or function. Determine and justify the similarity or congruence for two geometric shapes. D English: Analyze commercials for fact or opinion. Math: Fill in missing numbers of ordered pairs for and algebraic function. Science: Discuss the impact of fat and cholesterol in nutrition and health. Social Studies: Identify and analyze primary and secondary source documents to understand usefulness of each. C 5 4 3 Calculate percentages of advertising in a newspaper. Tour the school building and identify examples of parallel and perpendicular lines, planes, and angles. Determine the median and mode of real data displayed in a histogram Organize and display collected data, using appropriate tables, charts, or graphs. 2 A B 1 1 2 3 4 5
 you need to organize and hold this event. Make a scale drawing of the classroom on grid paper, each group using a different scale. Analyze the graphs of the perimeters and areas of squares having different-length sides. Determine the largest rectangular area for a fixed perimeter. Identify coordinates for ordered pairs that satisfy an algebraic relation or function. Determine and justify the similarity or congruence for two geometric shapes. D. English: Analyze commercials for fact or opinion. Math: Fill in missing numbers of ordered pairs for and algebraic function. Science: Discuss the impact of fat and cholesterol in nutrition and health. Social Studies: Identify and analyze primary and secondary source documents to understand usefulness of each. C Calculate percentages of advertising in a newspaper. Tour the school building and identify examples of parallel and perpendicular lines, planes, and angles. Determine the median and mode of real data displayed in a histogram. Organize and display collected data, using appropriate tables, charts, or graphs. 2. A. B")
46
D C B A Elementary Examples 6 5 4 3 2 1 1 2 3 4 5
Obtain historical data about local weather to predict the chance of snow, rain, or sun during year. Test consumer products and illustrate the data graphically. Plan a large school event and calculate resources (food, decorations, etc.) you need to organize and hold this event. Make a scale drawing of the classroom on grid paper, each group using a different scale. Science: Classify a group of similar objects to create a dichotomous key. Math: Use a balance to predict and determine equivalent value. English: Describe mystery objects to partners to strengthen use of descriptions. Social Studies: Contrast citizens’ roles/responsibilities under different forms of government. D C 5 4 3 Calculate percentages of advertising in a newspaper. Tour the school building and identify examples of parallel and perpendicular lines, planes, and angles. Determine the median and mode of real data displayed in a histogram Organize and display collected data, using appropriate tables, charts, or graphs. Express probabilities as fractions, percents, or decimals. Classify triangles according to angle size and/or length of sides. Calculate volume of simple three- dimensional shapes. Given the coordinates of a quadrilateral, plot the quadrilateral on a grid. 2 A B 1 1 2 3 4 5
 you need to organize and hold this event. Make a scale drawing of the classroom on grid paper, each group using a different scale. Science: Classify a group of similar objects to create a dichotomous key. Math: Use a balance to predict and determine equivalent value. English: Describe mystery objects to partners to strengthen use of descriptions. Social Studies: Contrast citizens’ roles/responsibilities under different forms of government. D. C Calculate percentages of advertising in a newspaper. Tour the school building and identify examples of parallel and perpendicular lines, planes, and angles. Determine the median and mode of real data displayed in a histogram. Organize and display collected data, using appropriate tables, charts, or graphs. Express probabilities as fractions, percents, or decimals. Classify triangles according to angle size and/or length of sides. Calculate volume of simple three- dimensional shapes. Given the coordinates of a quadrilateral, plot the quadrilateral on a grid. 2. A. B")
47
Quadrant D Verbs Products evaluation evaluate newspaper validate
estimation trial editorial radio program play collage machine adaptation poem debate new game invention evaluate validate justify rate referee infer rank dramatize argue conclude

48
D C B A High School Examples 6 5 4 3 2 1 1 2 3 4 5
Analyze the graphs of the perimeters and areas of squares having different-length sides. Determine the largest rectangular area for a fixed perimeter. Identify coordinates for ordered pairs that satisfy an algebraic relation or function. Determine and justify the similarity or congruence for two geometric shapes. English: Develop guidelines for publishing content on Internet pages. Math: Determine types of measure-ments/calculations involved in designing everyday items. Science: Discuss the ethical, social, and emotional consequences of genetic testing. Social Studies: Conduct a survey and analyze results on First Amendment issues related to Internet use. D C 5 4 3 Calculate percentages of advertising in a newspaper. Tour the school building and identify examples of parallel and perpendicular lines, planes, and angles. Determine the median and mode of real data displayed in a histogram Organize and display collected data, using appropriate tables, charts, or graphs. Express probabilities as fractions, percents, or decimals. Classify triangles according to angle size and/or length of sides. Calculate volume of simple three- dimensional shapes. Given the coordinates of a quadrilateral, plot the quadrilateral on a grid. 2 A B 1 1 2 3 4 5

49
D C B A Middle School Examples 6 5 4 3 2 1 1 2 3 4 5
Obtain historical data about local weather to predict the chance of snow, rain, or sun during year. Test consumer products and illustrate the data graphically. Plan a large school event and calculate resources (food, decorations, etc.) you need to organize and hold this event. Make a scale drawing of the classroom on grid paper, each group using a different scale. Analyze the graphs of the perimeters and areas of squares having different-length sides. Determine the largest rectangular area for a fixed perimeter. Identify coordinates for ordered pairs that satisfy an algebraic relation or function. Determine and justify the similarity or congruence for two geometric shapes. D English: Create a Bill of Rights for your school or classroom. Math: Use graphing calculators and computer spreadsheets to organize and analyze data. Science: Develop a concept for a new product and research the process for patenting the design. Social Studies: Research and present opinions of candidates running for office. C 5 4 3 Calculate percentages of advertising in a newspaper. Tour the school building and identify examples of parallel and perpendicular lines, planes, and angles. Determine the median and mode of real data displayed in a histogram Organize and display collected data, using appropriate tables, charts, or graphs. 2 A B 1 1 2 3 4 5
 you need to organize and hold this event. Make a scale drawing of the classroom on grid paper, each group using a different scale. Analyze the graphs of the perimeters and areas of squares having different-length sides. Determine the largest rectangular area for a fixed perimeter. Identify coordinates for ordered pairs that satisfy an algebraic relation or function. Determine and justify the similarity or congruence for two geometric shapes. D. English: Create a Bill of Rights for your school or classroom. Math: Use graphing calculators and computer spreadsheets to organize and analyze data. Science: Develop a concept for a new product and research the process for patenting the design. Social Studies: Research and present opinions of candidates running for office. C Calculate percentages of advertising in a newspaper. Tour the school building and identify examples of parallel and perpendicular lines, planes, and angles. Determine the median and mode of real data displayed in a histogram. Organize and display collected data, using appropriate tables, charts, or graphs. 2. A. B")
50
D C B A Elementary Examples 6 5 4 3 2 1 1 2 3 4 5
Analyze the graphs of the perimeters and areas of squares having different-length sides. Determine the largest rectangular area for a fixed perimeter. Identify coordinates for ordered pairs that satisfy an algebraic relation or function. Determine and justify the similarity or congruence for two geometric shapes. Science: Design a candy dispenser that works without gravity. Math: Calculate change of values to double or halve a recipe. English: Create new words to describe phenomena or objects. Social Studies: Research a location in the US and explain why it is a good place to live. D C 5 4 3 Calculate percentages of advertising in a newspaper. Tour the school building and identify examples of parallel and perpendicular lines, planes, and angles. Determine the median and mode of real data displayed in a histogram Organize and display collected data, using appropriate tables, charts, or graphs. Express probabilities as fractions, percents, or decimals. Classify triangles according to angle size and/or length of sides. Calculate volume of simple three- dimensional shapes. Given the coordinates of a quadrilateral, plot the quadrilateral on a grid. 2 A B 1 1 2 3 4 5

51
Teacher/Student Roles
Rigor/Relevance Framework Teacher/Student Roles D C Student Think Student Think & Work RIGOR High A B Teacher Work Student Work Low Low High RELEVANCE

52
Successful Curriculum Reform
Why Do We Need to Change Schools? What Needs to Be Done? How Do We Do It?

53
Rigor/Relevance - Instruction
Key Elements Backwards Design – “Begin with the End in Mind” Alignment of Instruction and Assessment Student-centered

54
Planning Rigorous and Relevant Instruction STEPS
Focus of Learning Student Performance Assessment Learning Experiences R/R Student Learning Standards Best Practices Reading Differences Alignment with Performance Alignment with Assessment

55
Planning Rigorous and Relevant Instruction
1. Focus of Learning What defines/drives learning? 2. Student Performance What are students expected to know/do and at what level of Rigor/Relevance? 3. Assessment How will you assess desired performance? 4.Learning Experiences What activities will enable students to achieve student performance?

56
Rigor/Relevance Framework
D Teacher gives students a real-world question to answer or problem to solve RIGOR High A B Low Low High RELEVANCE

57
C D A B Rigor/Relevance Framework RIGOR High Low Low High RELEVANCE
Students seek information to answer question or solve problem Low Low High RELEVANCE

58
Rigor/Relevance Framework
D RIGOR High A B Students test the relevancy of the information as it relates to the question or problem Low Low High RELEVANCE

59
Rigor/Relevance Framework
D Students reflect on the potential use of the new information as a solution RIGOR High A B Low Low High RELEVANCE

60
Rigor/Relevance Framework
D Students apply the information learned to answer the question or to solve the problem RIGOR High A B Low Low High RELEVANCE

61
C D A B Rigor/Relevance Framework RIGOR High Low Low High RELEVANCE
Students apply the information learned to answer the question or to solve the problem Students reflect on the potential use of the new information as a solution RIGOR High A B Students test the relevancy of the information as it relates to the question or problem Students seek information to answer question or solve problem Low Low High RELEVANCE

62
Research When to Use Strategy Based on Rigor/Relevance Framework

64
Instructional Strategies: How to Teach for Rigor and Relevance

65
Selection of Strategies Based on
Rigor/ Relevance Framework Page 1

66
Selection of Strategies Based on
Rigor/ Relevance Framework Page 2

67
Rigor/Relevance Framework
Strategies D C Compare and Contrast Summarizing Design a Real World Product Teach Others High R I GOR A B Make, Produce, Perform Role Play Low Low High RELEVANCE

68
Rigor/Relevance Framework
KNOWLEDGE Problems C D Projects Activities B A A P P L I C A T I O N

69
Assessment

70
Rigorous and Relevant Instruction
Types of Assessment Multiple Choice Constructed Response Extended Response Process Performance Product Performance Portfolio Interview Self Reflection

71
Rigor/Relevance Framework
High Traditional Tests Performance Low Low High 13

73
• Constructed Response
sessments KNOWLEDGE • Portfolio • Product Performance • Interview • Self Reflection • Extended Response • Product Performance • Process Performance • Product Performance • Multiple Choice • Constructed Response A P P L I C A T I O N

74
Rigor/Relevance Framework Did Students Get it Right?
Rational Answer Right Questions RIGOR High A B Right Answer Right Procedure Low Low High RELEVANCE

75
R/R and Assessment Suggestions.....
Determine the level of Rigor and Relevance on state tests. Develop your tests to parallel state tests when preparing for them. Use performance assessment when you want Quadrant D achievement Keep level of assessment consistent with expectation for performance. Let students know assessment in advance

76
Ways to Increase Rigor/Relevance
Design Gold Seal Lesson - culminate w/ performance Modify existing lesson - add high RR performance (adapt Gold Seal Lesson) change assessments change strategies Interdisciplinary instruction Integrate academics in CTE and Arts
 change assessments. change strategies. Interdisciplinary instruction. Integrate academics in CTE and Arts.")
77
Creating Gold Seal Lessons

78
Gold Seal Lessons

79
Steps in Gold Seal Lessons
Start with a focus of unit (grade, course, topics, title) Identify the Student Learning Brainstorm the Student Work Create Performance Task Create Assessment Build Rest of Lesson Add Procedures to Performance Prepare Student Materials Link to Standards/Essential Skills
 Identify the Student Learning. Brainstorm the Student Work. Create Performance Task. Create Assessment. Build Rest of Lesson. Add Procedures to Performance. Prepare Student Materials. Link to Standards/Essential Skills.")
80
Starbucks Scenario. Starbucks® is contemplating a viral marketing strategy and has hired your digital design company to conceptualize and develop a design solution to effectively promote the Starbucks® brand. Having been briefed by the client ,your team brainstormed various design concepts and decided to develop an animation sequence. Description. Working as a member of a design team, you are to develop a 20 to 30 second animation sequence using After Effects®. Additionally, you are to develop a design proposal that explains your solution. Subsequently, your team presents its solution to the client.

85
Sources of Gold Seal Lessons
Publications Original K lessons K-8 or lessons each Subject specific - 30 lessons Curriculum Matrix - samples Successful Practices Network 1800 and growing Gold Seal Lesson Service

87
Rigor/Relevance Framework Quiz Which Quadrant is labeled as
High Rigor and High Relevance? This quadrant also leads to greater student engagement and learning retention. A B C D

88
Effects of Rigor/Relevance Framework
Simple, versatile and powerful Something new that builds on what teachers know Inclusive Shift focus to Student Learning Avoids defending current practice Framework for selecting strategies and assessments Agenda for collaboration Natural build 88

89
Questions and Answers with Al
This is the end of the presentation portion. Submit questions at this time and stay on to hear the answers. If you are logging off, thank you for attending and we will you with follow-up information. For more information

90
Thank you for attending! www.LeaderEd.com
Rigor, Relevance and Relationships Workshops, On-going training, Train-the-trainer Keynote Speakers Model Schools Conference Resource Kits and Handbooks (518) |
 |")
91
19th Annual Model Schools Conference
June 26-29, Nashville Showcasing the nation’s most successful practices for improving student achievement and growth!

92
Leadership Academy Building Leadership Capacity January 28 - 30, 2011
San Diego Quadrant D Leaders are Focused on Learning Flexible Analytical Passionate & Motivational Communicative

Similar presentations