Download presentation
Presentation is loading. Please wait.

1
Aquatic Biodiversity Ocean 91% of all water Polar ice caps and glaciers 2.3% Lakes, streams, and rivers 2.8% Rest largely groundwater

2
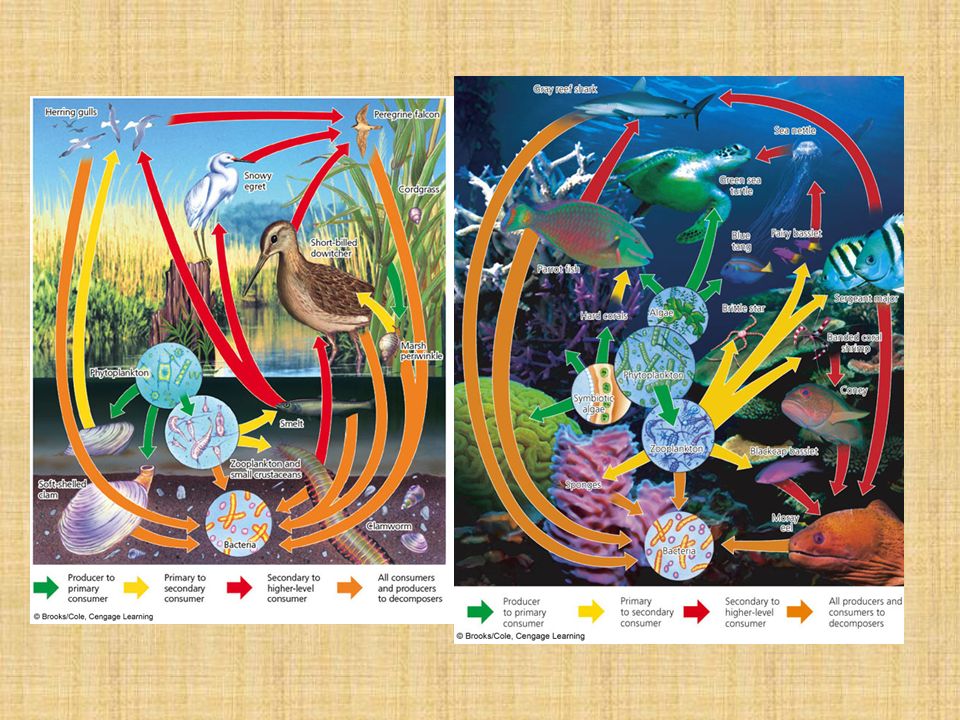
Aquatic Biota Plankton – live in water column Nekton – active swimmers in water column Benthos – live on or in bottom sediments

3
Fig. 8-4, p. 165 Marine Ecosystems Economic Services Climate moderation Food CO 2 absorption Animal and pet feed Nutrient cycling Pharmaceuticals Harbors and transportation routes Waste treatment Reduced storm impact (mangroves, barrier islands, coastal wetlands) Coastal habitats for humans Recreation Habitats and nursery areas Employment Genetic resources and biodiversity Oil and natural gas Minerals Scientific information Building materials Ecological Services NATURAL CAPITAL
 Coastal habitats for humans Recreation Habitats and nursery areas Employment Genetic resources and biodiversity Oil and natural gas Minerals Scientific information Building materials Ecological Services NATURAL CAPITAL.")
4
Three Marine Life Zones Coastal Open ocean Ocean bottom

5
Differences in diversity and life histories

6
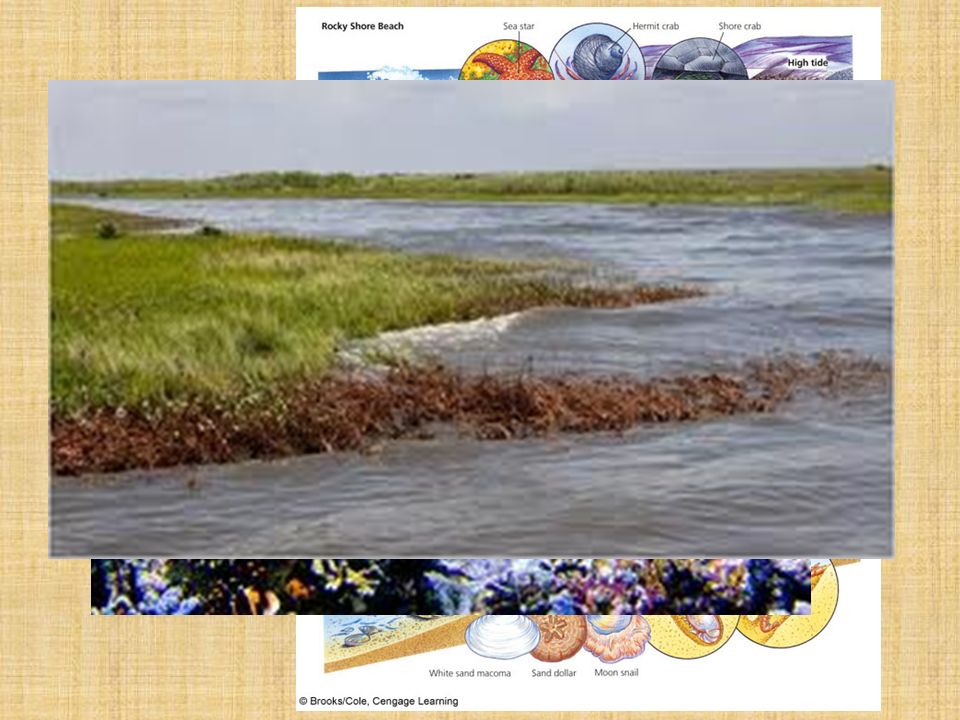
Coastal Zone Book = “harsh” Spatial and temporal variation in abiotic conditions High diversity (10% of ocean area, 90% of marine species) Among most productive environments Most commercial fisheries (60% human pop along coast and estuaries) Why diverse?
 Among most productive environments Most commercial fisheries (60% human pop along coast and estuaries) Why diverse")
8
Estuaries – Critical Habitats Junction of river and ocean (can be expanded to other aquatic environments) Nutrient and sediment inputs – highly productive Important nursery and productive hotspot
 Nutrient and sediment inputs – highly productive Important nursery and productive hotspot")
9
Estuaries – Threatened Habitats Loss sediment inputs Nutrient loading Channelization River regulation Development Also, Chesapeake Bay (p. 172-173) Mississippi River deltaic fan
 Mississippi River deltaic fan.")
10
Threats not limited to coastal zone Many continental shelf fisheries replaced with deepwater fisheries (600 – 1800 m) Example – orange roughy Slow growing Slow population growth (delay to reproductive maturity
 Example – orange roughy Slow growing Slow population growth (delay to reproductive maturity")
12
Fig 8-12

13
NATURAL CAPITAL Freshwater Systems Ecological Services Economic Services Climate moderationFood Nutrient cycling Drinking water Waste treatment Irrigation water Flood control Hydroelectricity Groundwater recharge Habitats for many species Transportation corridors Genetic resources and biodiversity Recreation Scientific information Employment

14
Lake Biodiversity

15
Lake Age Over Time Oligotrophic Mesotrophic Eutrophic Rate of aging varies based on basin characteristics: Geology Nutrient Climate Lake topography Inflows and outflows

16
Steams and Rivers

17
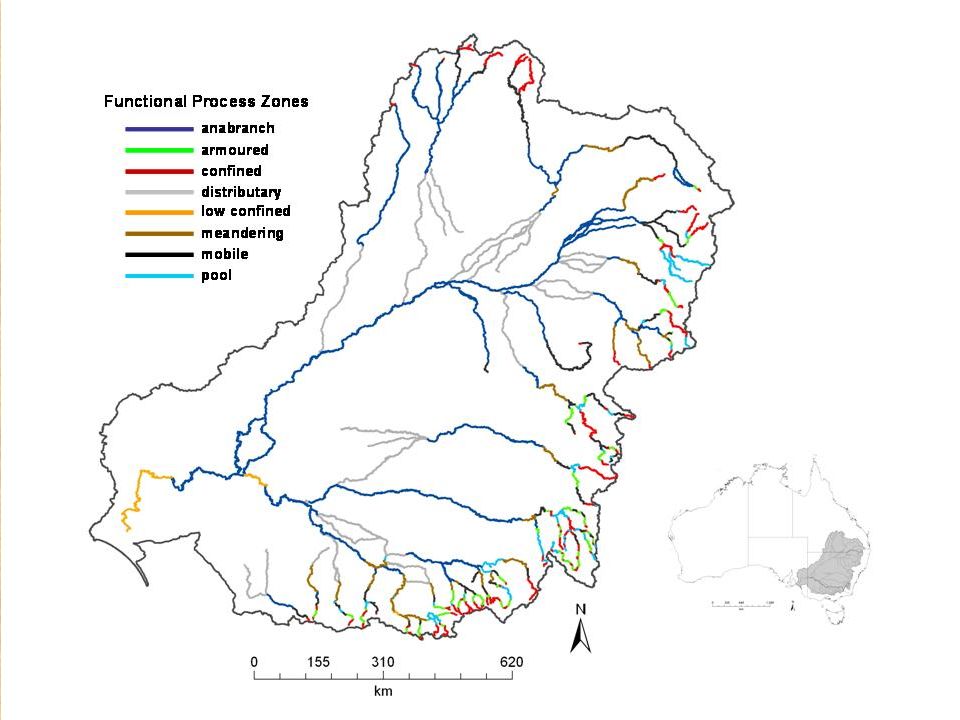
This is a general pattern, but is an oversimplification of the dynamics of streams and rivers (river networks)
")
19
It is not where you are on a longitudinal gradient (e.g., river continuum concept) Hydrological and geomorphological character of the area of interest determines: Nutrient and sediment storage and transport Ecological structure and function Thorp et al. (2008). Riverine Ecosystem Synthesis
. Riverine Ecosystem Synthesis.")
20
Not all Rivers Find Their Way to the Ocean

21
Human Impacts on Freshwaters Regulation – Dams, channelization, levees Water Abstraction – Irrigation – Diversion Pollution – Organic – Nutrient loading – Metals and complex compounds

Similar presentations


 Biodiversity Formation Important ecological and economic.>")


>")


 Ecosystems Ocean: estuaries & coastal wetlands barrier islands coral reefs mangroves Freshwater Ecosystems lakes rivers.>")


