Download presentation
Presentation is loading. Please wait.

1
CDR Tom Hochberg Health Services Administrator 2012 USPHS Scientific and Training Symposium FedStrive: Quantifying Behavior Change & Health Outcomes

2
In support of President Obama's Federal Employee Worksite Wellness Initiative, Secretary Kathleen Sebelius introduced FedStrive: a comprehensive, integrated Health, Wellness, and Work/Life Program that motivates, empowers and provides resources to improve the health of HHS federal employees and work in a greener more sustainable environment.

3
Elements of Comprehensive Worksite Wellness Programs Health education Supportive social and physical environment Integration into organizational structure Screening programs Linkages with related benefits

4
Serves ~ 3000 HHS employees at HQ complex Encourages active participation in achieving a healthier, greener lifestyle. “I want to be” to “I am” Helps translate personal goals from: “I want to be” to “I am” Provides access to integrated, innovative, comprehensive and customized tools and programs Helps maintain a happy, healthy, balanced life.

5
Organization and Employee Wellness Integration i want to be _______________. stress free fit and healthy mentally engaged highly productive

6
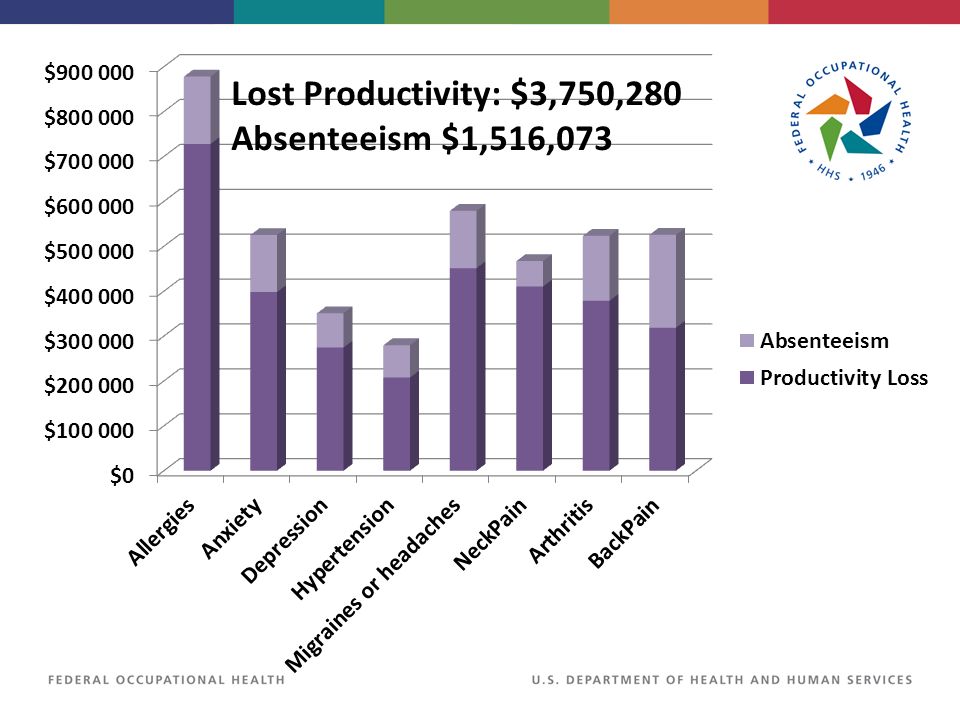
Distribution and Migration of Employees 15% High Risk 25% Moderate Risk 60% Low Risk 0 – 2 Risks 3 – 4 Risks 5 or more Risks $ $$ $$$ Source: Leading by Example: Improving the Bottom Line Through a High Performance, Less Costly Workforce CEOs on the Business Case for Worksite Health Promotion. Copyright © Partnership for Prevention ® 2005, page 7. This publication may be downloaded free of charge on Partnerships Web site, www.prevent.org/LBE Implications for Employers Higher prevalence of chronic health conditions Higher direct medical costs Higher absenteeism Higher disability and workers’ comp costs Lower productivity Implications for Employees Greater probability of chronic health conditions Higher out-of –pocket medical/pharm. Costs Greater pain and suffering Lower quality of life Lower personal effectiveness on and off the job Implications for Employers Healthier, productive workforce Lower direct and indirect health –related costs Implications for Employees More independence/health Lower medical costs Greater energy and vitality Increase life and job satisfaction

7
Program Participation *Influenza counts for FY 2010 and FY 2011 include HHS contract employees **Health education attendance includes AED/CPR classes in FY 2011

8
The Health Risk Appraisal −An individualized assessment: Assess health status Estimate levels of health risk Inform and provide feedback to participants to motivate behavior change to reduce health risks −Areas assessed include: Demographics (age, gender) Chronic disease (hypertension, diabetes, migraines) Biometrics (height, weight, blood pressure) Lifestyle (exercise, smoking, diet, alcohol) Attitudes and willingness to change
 Chronic disease (hypertension, diabetes, migraines) Biometrics (height, weight, blood pressure) Lifestyle (exercise, smoking, diet, alcohol) Attitudes and willingness to change")
9
Measuring health risk Health Risks and Behaviors 1 AlcoholStressIllness days Blood PressureSmokingJob Satisfaction BMISafety Belt UsageLife Satisfaction CholesterolSmokingPerception of health Existing Medical ProblemsHDL CholesterolPhysical activity 1 Edington DW. Emerging Research. A view from one research center. The Science of Health Promotion. May/June 2001:15(5): 341-349.
:")
10
Top 8 Controllable Risk Factors Data Source: Total population who completed at least one HA at any point during the program (n = 1,822)
")
11
Trends in Health Risk Source: HRA (SWC, Federal, by Fiscal Year). FY 2012 only represents 6 months of data.

12
Low Risk Medium Risk High Risk Non-Participant Edington. AJHP. 15(5):341-349, 2001 Costs Associated with Risks Medical Paid Amount x Age x Risk
: , 2001 Costs Associated with Risks Medical Paid Amount x Age x Risk.")
13
FedStrive vs. Natural Flow ( p < 0.05 )
")
14
Changes in frequency of Exercise Data Source: Total population who completed consecutive HA’s in FY 10 and FY 11 (n = 444) -34.0%-20% -4% +10.5% +16.1%
 -34.0%-20% -4% +10.5% +16.1%")
15
Changes in BMI Data Source: Total population who completed consecutive HA’s in FY 10 and FY 11 (n = 444) -2.1% -9.4%+12.6
 -2.1% -9.4%+12.6")
16
The Association of Stress on Selected Risk Factors

18
Social Media Strategies to Integrate Health & Wellness

19
Bring the FedStrive “Experience” to Life Health Performance

20
Go Where They Are. Which social media applications do you use and for which purpose? Outlet % “Personal and Professional” Responses YouTube17.9 Facebook12.1 Twitter11.6 Please rank how else you would prefer to receive information from FedStrive. Outlet % with “Most Preferred” Responses Facebook24.7 Twitter15.5 YouTube10.1

21
Be High Profile.

22
Tweet, Tweet. −Health and wellness tips −“Did You Know” teasers re: services, new resources/toolkits −Event announcements −New audio or video content −News and observances

23
When Viral Is A Good Thing…

24
Be Mobile. −Fitness Updates −Health Calendar −Wellness Tips −Classes, Events −Program Promotion −QR Codes

25
Leverage the Social Butterflies. Complete list available at newmedia.hhs.gov.

26
The Road Ahead: Game On!

27
In a Virtual World…

28
Get Social. JOIN OUR NETWORKS: i want to be connected. twitter.com/#!/FEDSTRIVE youtube.com/user/FedStriveVideos facebook.com/FedStrive

Similar presentations