Download presentation
Presentation is loading. Please wait.

2
Unit 1 Foundations of Chemistry – Expectations, Lab Safety, Measurement and Analysis

3
Math – the language of chemistry Pre-Test Review Pre-Test

4
Lab Safety

5
Why is Lab Safety Important? Lab safety is a major aspect of every lab based science class. Lab safety rules and symbols are needed so that students do not injure themselves or their classmates.

6
Lab Safety Video Demos Why do you need to wear eye protection? I wear contacts? What happens if I spill acid on my skin? Why do I have to label materials? Why shouldn’t I drink in the lab and why can’t I dump everything down the sink?

7
Lab Safety Equipment PPE (Personal Protective Equipment) Safety Shower Eye Wash Fire Extinguisher Fire Blanket
 Safety Shower Eye Wash Fire Extinguisher Fire Blanket")
8
Lab Safety Equipment Safety ShowerSafety Goggles Eye Wash

9
Waste Disposal First ask your teacher where/how to dispose of waste. Never pour anything down the drain unless you are told to do so. It can affect the community’s water, plants, animals & people. A waste bottle will be supplied for substance that cannot go down the drain

10
Fire Drill Why should I pay attention? Why should I pay attention? Where do we go? Class leader?

11
Lab Safety Continued Lab Safety Contract Lab Safety Crossword Puzzle

12
Nature of Science Mystery Solutions Lab

13
12 The Nature of Science* Humans have a need to: Understand the world around them Change their environment using technology in order to accommodate what they understand or desire Natural curiosity vs. making life better Science begins with observations, therefore, much of science is purely descriptive. Science uses both deductive and inductive reasoning. * Adapted from Next Generation Science Standards

14
13 The Nature of Science* Basic Understandings of Science Scientific investigation uses a variety of methods (NOT just scientific method) Scientific knowledge is based on EVIDENCE! Scientific knowledge can change based on new evidence Use models, theories, laws, mechanisms to describe natural phenomenon Assumes order in nature Human’s “do” science Addresses questions about the natural AND material world * Adapted from Next Generation Science Standards

15
Chemistry Lab Analysis

16
Lab Analysis Chemistry labs are designed to investigate a problem or questions Procedure designed Data is collected. Analysis section interprets the data

17
Lab Analysis 3 Tools for Lab Analysis: 1. Observation & Inferences 2. Accuracy & Precision 3. Graph Construction & Analysis

18
(I) Observation & Inference
 Observation & Inference")
19
Observations Any information collected with the senses. The skill of describing scientific events.

20
Observations 22 Types QQualitative observations = descriptive observations, no numbers involved (i.e. color, texture, smell) QQuantitative observations = observations described by a numbered measurement. (i.e. 5 meters, 30 seconds, 32 mL)
 QQuantitative observations = observations described by a numbered measurement. (i.e. 5 meters, 30 seconds, 32 mL).")
21
Inference Conclusions or deductions based on observations *May be influenced by prior knowledge. Process of drawing a conclusion from given evidence.

22
Tracks like these are common in parts of New England and in the southwestern United States. What do you OBSERVE? What can you INFER?

23
Now what do you think?

24
Infer what happened based on your observations.

25
Observation Activity #1 Observe the picture for exactly 30 seconds. Look at everything you think might be important.picture After 30 seconds, answer the questions on the next page on a sheet of paper. How observant were you? Compare your answers to the picture.

27
Questions: 1. Are there cars parked on the sides of the road? 2. What color is the pickup truck driving in the road? 3. Any minivans around? 4. What does the blue sign say? 5. What’s the speed limit? 6. Are there any pedestrians on the road?

28
Question 1 Are there cars parked on the side of the road?

29
Question 2 What color is the pickup truck driving in the road?

30
Question 3 Any minivans around?

31
Question 4 What does the blue sign say?

32
Question 5 What's the speed limit?

33
Question 6 Are there any pedestrians on the road?

34
Observation Activity #2 Observe the picture for exactly 30 seconds. Look at everything you think might be important.picture After 30 seconds, answer the questions on the next page on a sheet of paper. How observant were you? Compare your answers to the picture.

36
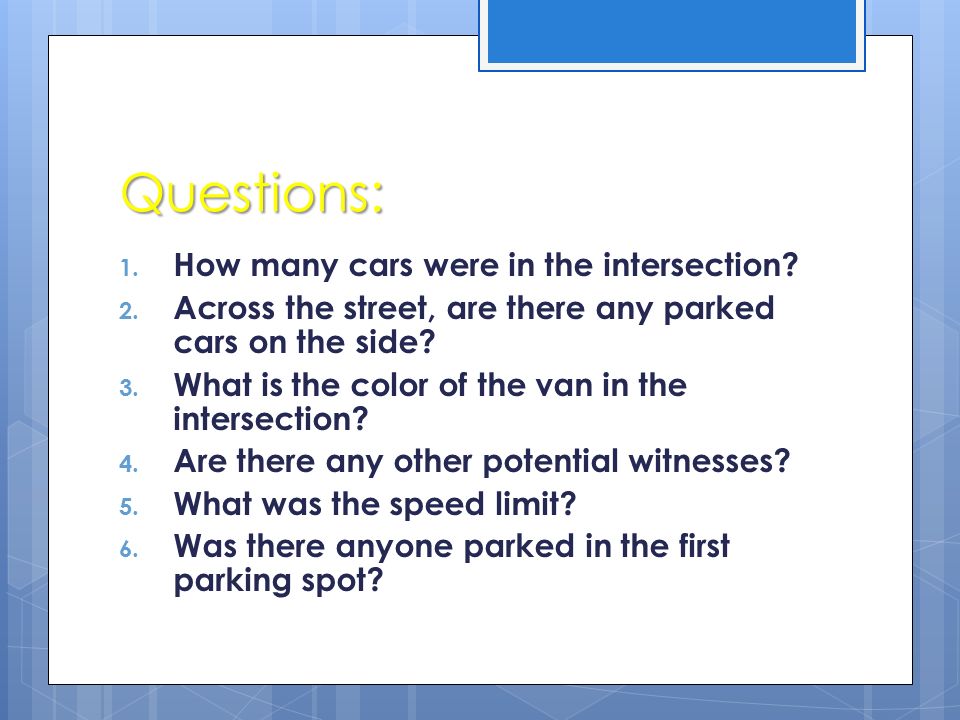
Questions: 1. How many cars were in the intersection? 2. Across the street, are there any parked cars on the side? 3. What is the color of the van in the intersection? 4. Are there any other potential witnesses? 5. What was the speed limit? 6. Was there anyone parked in the first parking spot?

37
Question 1 How many cars were in the intersection?

38
Question 2 Across the street, are there any parked cars on the side?

39
Question 3 What is the color of the van in the intersection?

40
Question 4 Are there any other potential witnesses?

41
Question 5 What is the speed limit?

42
Question 6 Was there anyone parked in the first parking space?

43
Accuracy & Precision Two important points in measurement

44
Accuracy Accuracy = the extent to which a measured value agrees with a standard value Accuracy of a device/tool Accuracy of reader Beware of Parallax – the apparent shift in position when viewed at a different angle.

45
Graduated Cylinder – Meniscus and Parallax

46
Example: Accuracy Who is more accurate when measuring a book that has a true length of 17.0 cm? Susan: 17.0 cm, 16.0 cm, 18.0 cm, 15.0 cm Amy: 15.5 cm, 15.0 cm, 15.2 cm, 15.3 cm

47
Precision Precision = the degree of exactness of a measurement that is repeatedly recorded. (smallest range of values) Which set is more precise? Susan: 18.2, 18.4, 18.35 Amy: 17.9, 18.3, 18.85 Tom: 16.8, 17.2, 19.44
 Which set is more precise. Susan: 18.2, 18.4, Amy: 17.9, 18.3, Tom: 16.8, 17.2,")
48
Example: Precision Who is more precise when measuring the same 17.0 cm book? Susan: 17.0 cm, 16.0 cm, 18.0 cm, 15.0 cm Amy: 15.5 cm, 15.0 cm, 15.2 cm, 15.3 cm

49
Exit Quiz: Evaluate whether the following are precise, accurate or both. Figure #1 Figure #2 Figure #3

50
Percent Error Percent deviation from the true (actual) value Measure of accuracy % error = l True – experimental l x 100 True
 value Measure of accuracy % error = l True – experimental l x 100 True")
51
II. Percent Error Example: AA student measured the density of an object to be 2.889 g/ml. The true density of the object is 2.699g/ml. What is the percent error of the experiment? Is the student accurate? ll 2.699 g/ml – 2.889 g/ml l x 100 = 7.040% error 2.699 g/ml Y Yes, student is accurate. AAnything below 10% is acceptable as accurate. The closer to 0% the better!

52
Why is it so important to be accurate and precise as a chemist? MMedicine – certain amounts can turn into lethal dosages WWork with flammable products TTo insure reproducible products (cosmetics, soap, hair products…) TTo insure quality of our environments (air and water quality)
 TTo insure quality of our environments (air and water quality).")
53
(III) Graphing
 Graphing")
54
2 Types of Graphs used in Chemistry Lab Line Graph A line graph shows the relationship between your variables. Usually used to show how things change over time.

55
2 Types of Graphs used in Chemistry Lab Bar Graph A bar graph is used to show a comparison of different trials or different experimental groups.

Similar presentations


 #9 Drinking from a beakerNo eating or drinking in lab.>")


