Download presentation
Presentation is loading. Please wait.

1
PREPARED BY Ömer Veli Yeşilyurt

2
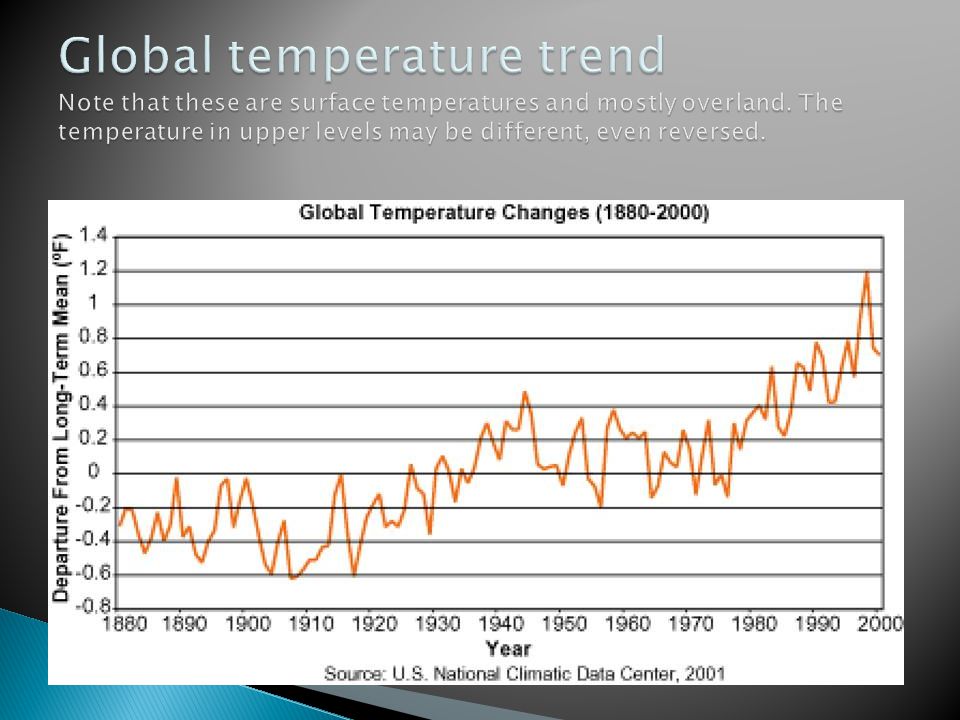
Global warming is the increase in the average measured temperature of the Earth's near-surface air and oceans since the mid-20 th century, and its projected continuation. The average global air temperature near the Earth's surface increased 0.74 ± 0.18 °C (1.33 ± 0.32 °F) during the 100 years ending in 2005. Global warming is a result of increasing concentrations of atmospheric aerosols that block sunlight from reaching the surface, has partially countered the effects of warming induced by greenhouse gases.aerosols Source: Intergovernmental Panel on Climate Change
 during the 100 years ending in Global warming is a result of increasing concentrations of atmospheric aerosols that block sunlight from reaching the surface, has partially countered the effects of warming induced by greenhouse gases.aerosols Source: Intergovernmental Panel on Climate Change.")
3
According to the National Academy of Sciences, the Earth's surface temperature has risen by about 1 degree Fahrenheit in the past century, with accelerated warming during the past two decades. There is new and stronger evidence that most of the warming over the last 50 years is attributable to human activities. Human activities have altered the chemical composition of the atmosphere through the buildup of greenhouse gases – primarily carbon dioxide, methane, and nitrous oxide. The heat- trapping property of these gases is undisputed although uncertainties exist about exactly how earth's climate responds to them. (source:US-EPA)
.")
6
What’s the difference between “global warming” and “climate change”?

7
GLOBAL WARMING is the increase of the Earth’s average surface temperature due to a build-up of greenhouse gases in the atmosphere. CLIMATE CHANGE is a broader term that refers to long- term changes in climate, including average temperature and precipitation.

8
Fossil fuels (coal, oil, natural gas) Carbon Dioxide (CO 2 )
 Carbon Dioxide (CO 2 )")
10
Burning of Fossil Fuels Pollution from coal, natural gas, and oil

11
There is a direct correlation between the measured human emissions of greenhouse gases, the rise in atmospheric greenhouse gases, and the rise in temperature. The rates of increase in each is unprecedented. There is a direct correlation between the growth in the human population and the rise in greenhouse gases and temperature. Computer simulations indicate that only human-caused emissions of greenhouse gases can cause the observed rise in temperature of the atmosphere and other Earth systems (Oceans, Continents and Ice). No other natural causes can account for the present rapid rise in temperature and CO 2. The present rate CO 2 increase is about 20,000 faster than natural rates.
. No other natural causes can account for the present rapid rise in temperature and CO 2. The present rate CO 2 increase is about 20,000 faster than natural rates..")
12
Greenhouse Effect Concentration of CO2 Feedback Effect Aerosols and Soot Solar Variation

13
Source: Intergovernmental Panel on Climate Change 240 Watt per m 3 343 Watt per m 3 103 Watt per m 3

14
The Sun’s energy passes through the car’s windshield. This energy (heat) is trapped inside the car and cannot pass back through the windshield, causing the inside of the car to warm up. Example of the Greenhouse Effect
 is trapped inside the car and cannot pass back through the windshield, causing the inside of the car to warm up. Example of the Greenhouse Effect.")
15
Carbon dioxide (CO 2 ) Methane (CH 4 ) Nitrous oxide (N 2 O) Hydrofluorocarbons (HFCs) Perfluorocarbons (PFCs) Sulphur hexafluoride (SF6) Source: Kyoto Protocol- Annexure A Natural Manmade
 Methane (CH 4 ) Nitrous oxide (N 2 O) Hydrofluorocarbons (HFCs) Perfluorocarbons (PFCs) Sulphur hexafluoride (SF6) Source: Kyoto Protocol- Annexure A Natural Manmade")
17
Global Atmospheric Concentration of CO 2

18
Physically, via the greenhouse effect. The connection is usually made via the use of a climate model. Control run versus scenarios. If the scenario run results show warmer surface condition than the control, then it is plausible to suspect that the increasing CO 2 concentration in the atmosphere may cause warming.

19
The climate system is very complicated. A change in one component of the system may cause changes in other components. Sometimes the changes in other components enhance the initial change, then we say that these changes have positive feedback to the system. If the changes result in the reduction of the original change, then they have negative feedback.

20
Both positive and negative feedback processes may exist in the climate system. In studying the global climatic change, we cannot make conclusions based on intuition, but have to take all such possible complicated effects into account. A good climate model would have treated all of them realistically.

21
The main positive feedback in global warming is the tendency of warming to increase the amount of water vapor in the atmosphere, a significant greenhouse gas. The main negative feedback is radiative cooling, which increases as the fourth power of temperature

22
Aerosols exert a cooling effect by increasing the reflection of incoming sunlight. The effects of the products of fossil fuel combustion have largely offset one another in recent decades, so that net warming has been due to the increase in greenhouse gases such as methane.

23
Atmospheric soot aerosols directly absorb solar radiation, which heats the atmosphere and cools the surface. Atmospheric soot always contributes additional warming to the climate system.

25
Ice Core Data CO 2 Measurements Before 1958 - Antarctica

26
Rising Sea Level Increased Temperature Habitat Damage and Species Affected Expansion of subtropical deserts Change in the amount and pattern of precipitation Extreme weather events Species extinctions

27
Increased Temperature Habitat Damage and Species Affected Changes in Water Supply Rising Sea Level

28
Alaska 19142004 Photos: NOAA Photo Collection and Gary Braasch – WorldViewOfGlobalWarming.org

29
Arizona June 2002Dec 2003

30
Ice shelves of the South Pole have partly separated and are collapsing. (NASA) Receding high mountain glaciers Melting ice and rising sea level
 Receding high mountain glaciers Melting ice and rising sea level.")
32
Of course the physical environmental change will lead to changes in the biosphere – including our society.

33
2007 Goal: Reductions in CO 2 Per Year Billions of Metric Tons Carbon

34
2007 Reductions in CO 2 Per Year Gigaton Carbon Produce electricity efficiently Use electricity efficiently Vehicle efficiency Solar and Wind Power Biofuels Carbon capture and storage Billions of Metric Tons Carbon Our Goal

35
Solar PowerWind PowerFuel-Efficiency

36
Turn off your computer or the TV when you’re not using it. Take shorter showers. Heating water uses energy. Keep rooms cool by closing the blinds, shades, or curtains. Turn off the lights when you leave a room. Use compact fluorescent bulbs.

37
Dress lightly when it’s hot instead of turning up the air conditioning. Or use a fan. Dress warmly when it’s cold instead of turning up the heat. Offer to help your parents keep the air filters on your AC and furnace clean. Walk short distances instead of asking for a ride in the car. Plant a tree. Recycle.

38
Incandescent Compact Fluorescent 500 lbs. of coal What’s the difference? 1,430 lbs. CO 2 pollution avoided $30 saved

39
Intergovernmental Panel on Climate Change www.wikipedia.com

Similar presentations


 is trapped inside the car and cannot pass back through the windshield, causing.>")


 and other gases, in the atmosphere increases Earth’s “greenhouse” effect and may cause climate.>")

 being pumped into the.>")


>")


