Download presentation
Presentation is loading. Please wait.

1
Two Variable Analysis Joshua, Alvin, Nicholas, Abigail & Kendall

2
Two Variable Analysis Firstly, two variable analysis is the analysis of two variables! For the purpose of determining the practical relationship between them. It is also known as bivariate analysis. Two variable analysis is the study of trends were patterns of two unknowns. in two variable analysis you can either have a positive, negative or no relationship.

3
It ’ s not just a school thing ! For example, in business it detects trends and could predict future progress, but only an estimate. In science you can use scatter diagrams to determine how temperature effects the rate of a certain reaction. Also in medicine, doctors can use scatter diagrams to determine if a certain medicine is helping their patients.

4
Independent and Dependent Variables Independent variable - a whose variation does not depend on that of another. Dependent Variables - a variable whose value depends on that of another.

5
A Scatter Diagram A scatter diagram is a graph in which the values of two variables are plotted along two axes, the pattern of the resulting points revealing any correlation present. Scatter Diagrams ( Plots ) are a very useful way to help you visually see data.
 are a very useful way to help you visually see data..")
6
How it’s drawn.. Draw a graph. Label the horizontal and vertical axis, with the variables they represent. Choose a range that includes the maximums and minimums from the given data. On the Horizontal axis ( "X" axis ) you place the Independent variable. On the vertical axis ( “ Y ” axis ) you place the Dependent variable Plot your data points at the intersection of your data plots of the X and Y values. Plot the remaining points on the graph.
 you place the Independent variable. On the vertical axis ( Y axis ) you place the Dependent variable Plot your data points at the intersection of your data plots of the X and Y values. Plot the remaining points on the graph..")
7
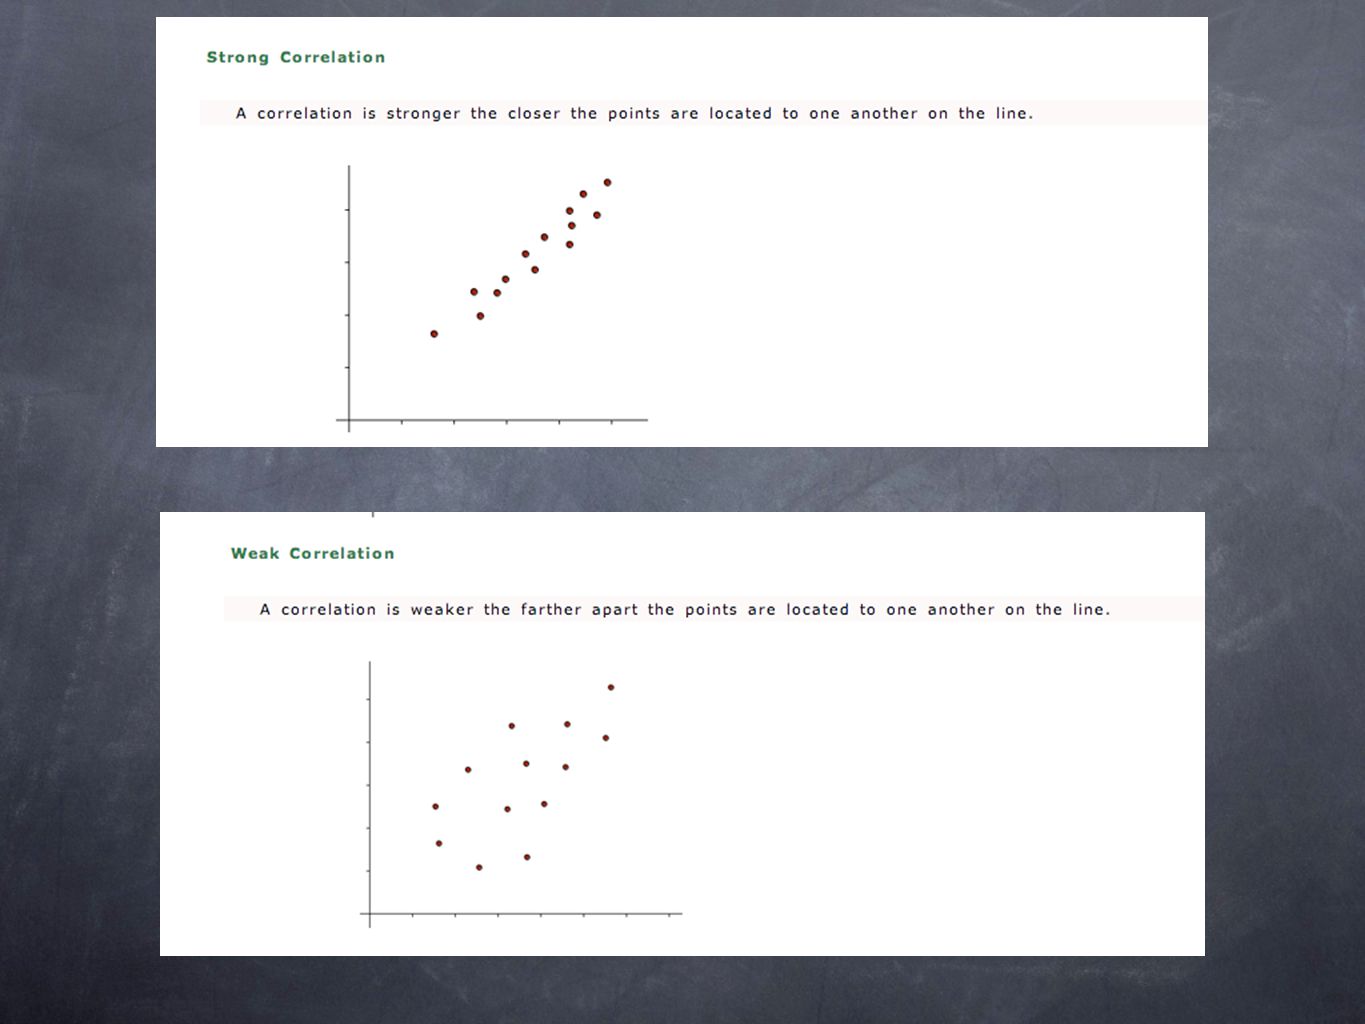
Correlation Correlation is a measure of strength of the relationship or association between two variables. There are six types of correlation : positive, negative, no, perfect, strong and weak correlation

11
Line of Best Fit Line of Best Fit is drawn through a scatterplot to find the direction of an association between two variables. This line of best fit can then be used to make predictions.

12
SOLUTION !

13
This is a visual estimate of the line passing through the middle of the data The line of best fit is drawn so that the points are evenly distributed on either side of the line When drawing the line of best fit, you need the line to go through the mean point. You first find the mean point of the x values and then the mean point of the y values. Plot ( x, y ) on the graph and the line of best fit must go through it. Line of Best Fit by eye
 on the graph and the line of best fit must go through it. Line of Best Fit by eye.")
14
Finding the equation for line of best fit If you draw a line of best fit, it is easier to determine the equation. note : the equation of a straight line is y = mx +c m is the gradient and c is the intercept we use rise over run

16
what ’ s it used for ? Line of best fit is used to predict the value of one variable based on a value of the other. It is also used to determine the strength of the correlation.

17
Interpolation and Extrapolation The data points with the lowest and highest ‘x’ values are called the poles. If we use values of x in between the poles, we say we are interpolating between the poles. If we use values of ‘x’ outside the poles, we say we are extrapolating outside the poles.

18
QUESTION TIME ! what is correlation ? how does a scientist use two variable analysis ? how many types of correlation are there ? I am an odd number. Take away one letter and I become even. What number am I ?

Similar presentations


 Height (inches) 1876.1 1977 2078.1 21 2278.8 2379.7 2479.9 2581.1 2681.2 2782.8 28 2983.5 Work with your group to make.>")


? Do Now: Copy the following: Line Graph - A graph that is used to display data that shows how one variable.>")