Download presentation
Presentation is loading. Please wait.

1
Scatter Diagrams Part One: Drawing Them

2
Lesson Objective To be able to draw a Scatter Diagram

3
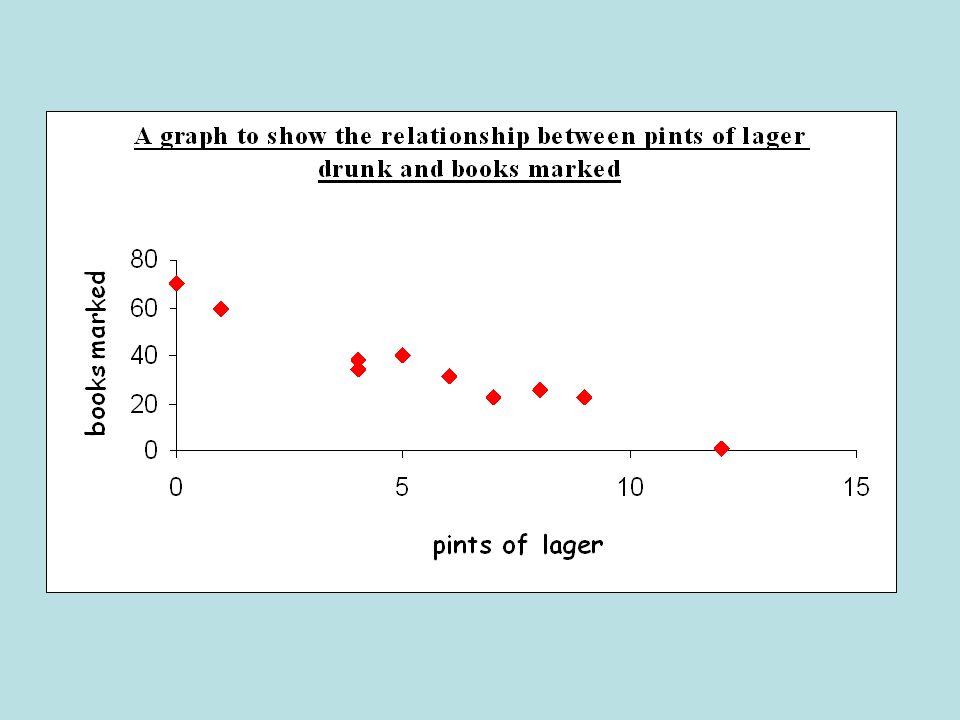
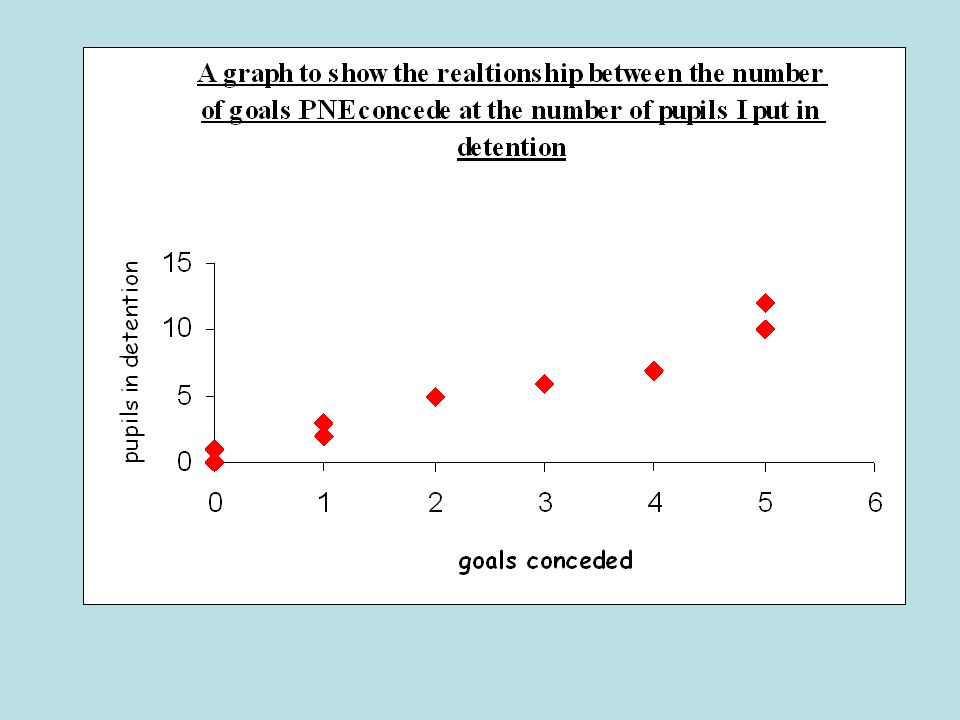
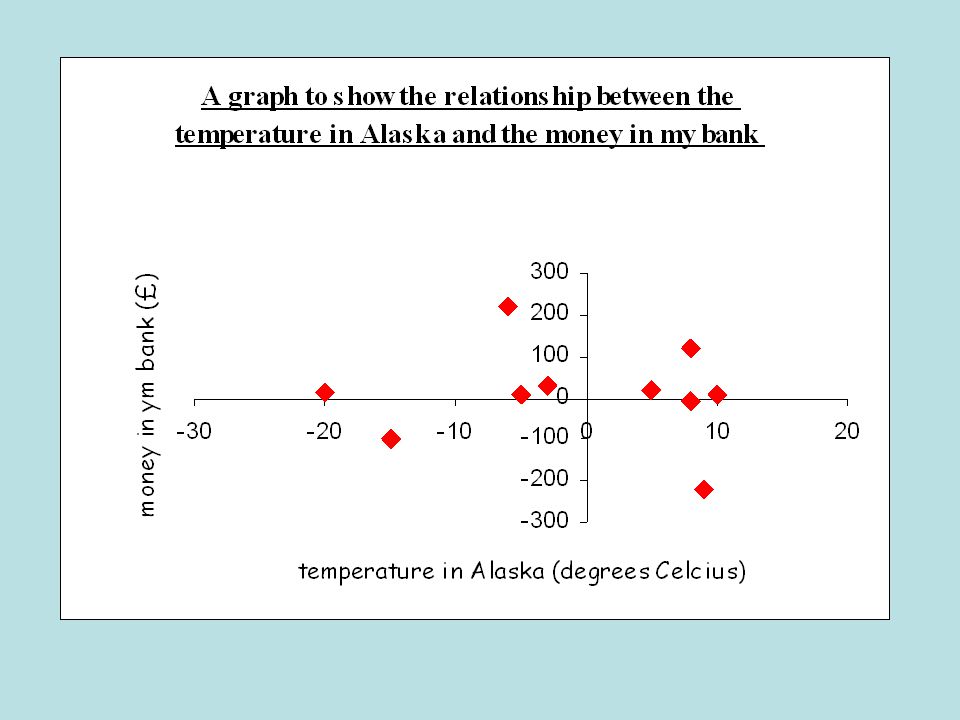
Scatter Diagrams A Scatter Diagram is a graph of unconnected points When drawing graphs, we must remember to do the following things: 1.Always give the graph a title 2.Always label both axis, including correct units 3.Choose a sensible scale 4.Plot your points carefully (x first, y second)
")
4
Pints of lager Mr. X has on a Saturday night 58914471260 Number of books he marks on a Sunday morning 4025226038342213170 Number of goals PNE concede at the weekend 1301250045 Number of pupils I put in detention on Monday 260351010712 Temperature in Alaska, Canada (degrees Celsius) 5-3-5108-20-68-159 Money in my bank account (£) 2031672215220-10-100-220
 Money in my bank account (£)")
8
Scatter Diagrams Part Two: Interpreting Them

9
Lesson Objective To be able to interpret Scatter Diagrams To understand the terms Correlation and the Line of Best Fit

16
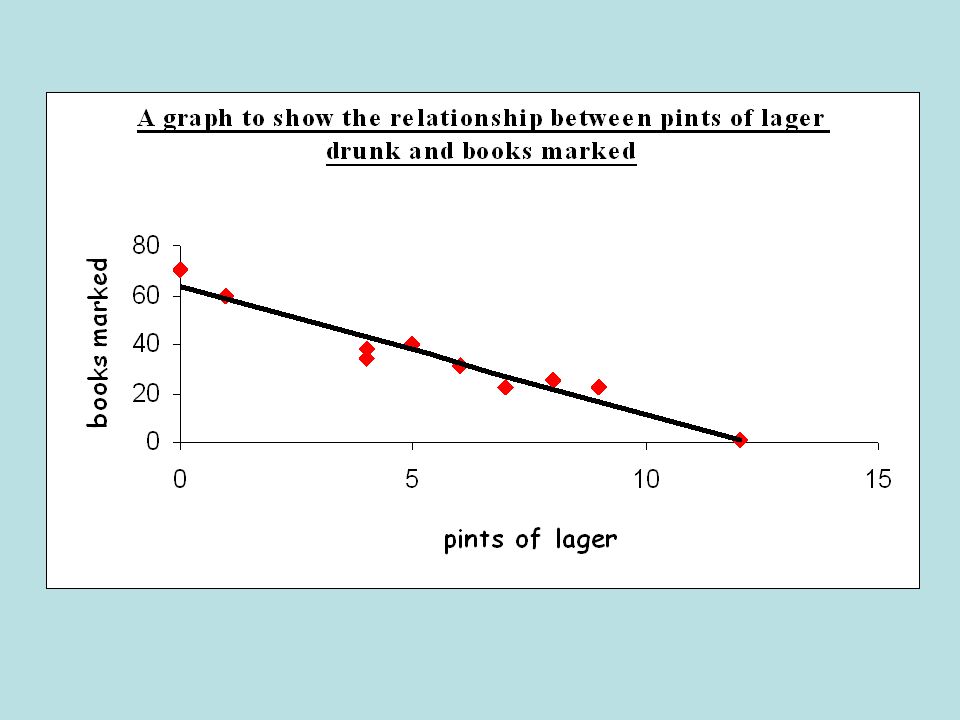
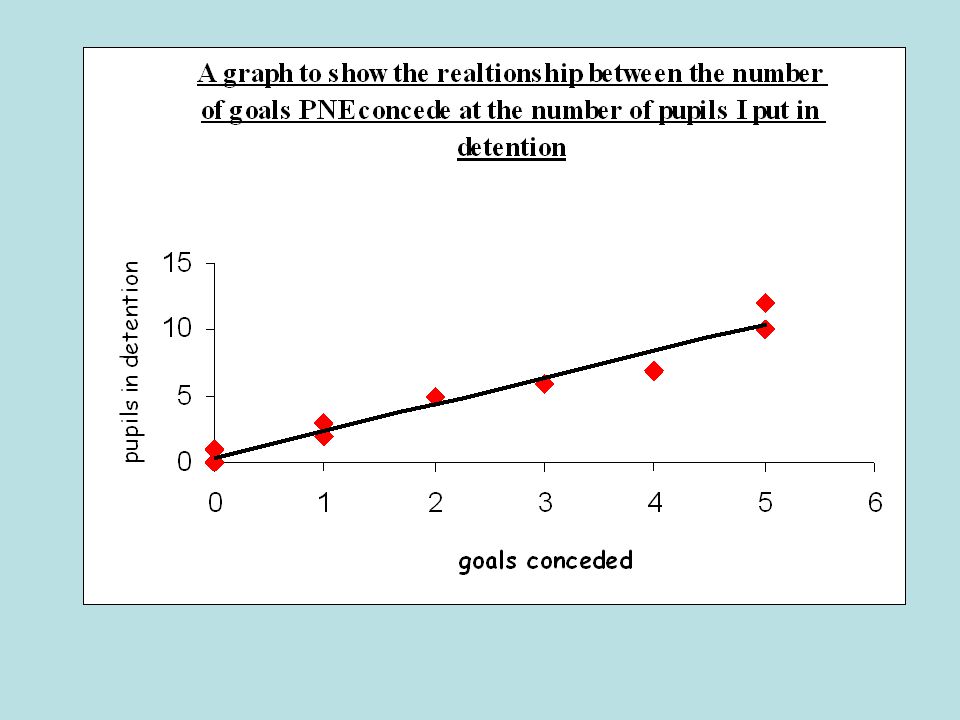
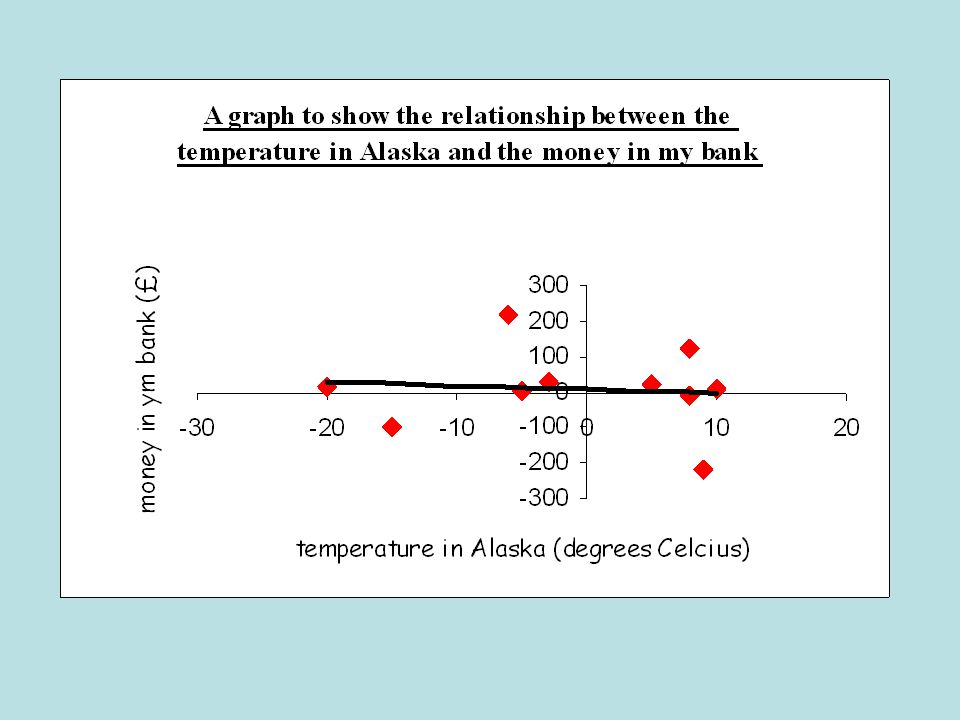
The relationship between two variables is called a Correlation A line of best-fit is a line which helps us to identify the type of correlation (positive, negative, no correlation) & make predictions The line of best fit is drawn so that the points are evenly distributed on either side of the line The closer the dots to the line, the stronger the correlation Remember: 1.The line of best fit is a STRAIGHT LINE 2.It DOES NOT have to pass through the origin 3.It DOES NOT have to go through each point Interpreting Scatter Diagrams
 & make predictions The line of best fit is drawn so that the points are evenly distributed on either side of the line The closer the dots to the line, the stronger the correlation Remember: 1.The line of best fit is a STRAIGHT LINE 2.It DOES NOT have to pass through the origin 3.It DOES NOT have to go through each point Interpreting Scatter Diagrams")
17
Correlation can be strong or weak Strong Positive Correlation All the points lie close to the line of best fit Weak Positive Correlation The points are well spread out from the line of best fit but still follow the trend

18
A bit of work… Exercise 10:2B, Page 229 Q1 - 3

Similar presentations