Download presentation
Presentation is loading. Please wait.

1
Health for All: Expanding Care, Saving Lives Sarah de Guia, Executive Director California Pan-Ethnic Health Network (CPEHN) April 12, 2015
 April 12, 2015")
2
CPEHN: Together We’re Stronger

3
Eliminating Health Disparities

4
Quiz Time

5
Question : How much do we spend on health care? How much does the U.S. spend per person on health care compared to the average of the other industrialized countries? A. Three quarters (75%) of the average B. The same C. One and a half times (150%) as much D. Two and a half times as much E. Four times as much Source: “Unnatural Causes…is inequality making us sick?” developed by California Newsreel based in part on a quiz developed by Stephen Bezruchka of Univ. of Wash. Population Health forum
 of the average B. The same C. One and a half times (150%) as much D. Two and a half times as much E. Four times as much Source: Unnatural Causes…is inequality making us sick developed by California Newsreel based in part on a quiz developed by Stephen Bezruchka of Univ. of Wash. Population Health forum.")
6
Answer: D. The U.S. spends more than two and a half times as much as other countries In 2011, the U.S. spent $8,508 on average per person compared to ~$3,000-$4,500 on average of OECD countries. Health care spending in the U.S. represented 17.7% GDP compared to just 9.3% GDP for OECD countries. The U.S. is paying a lot more than most other countries for health care so we should be living longer, right? Source: Organization for Economic Cooperation and Development, Health at a Glance 2013

7
Question: How long do we live? Q. How does U.S. life expectancy compare to other countries? A. #1D. 20 th Place B. in the top 5E. 26 th Place C. in the top 10 Source: “Unnatural Causes…is inequality making us sick?” developed by California Newsreel based in part on a quiz developed by Stephen Bezruchka of Univ. of Wash. Population Health forum

8
Answer : E. The U.S. ranks 26 th place for life expectancy At 78.7 years, life expectancy is more than a year less than the average life expectancy of 80.1 years for OECD countries. Italy and France spend less than half as much as the U.S. on health care yet they rank 3 rd and 6 th in life expectancy Source: Organization for Economic Cooperation and Development, Health at a Glance 2013

10
Why aren’t we living longer? As one of the wealthiest countries in the world, that spends more on health care, why aren’t we living longer?

11
Because… Some explanations for this are: 1)Our fragmented health care system. 2)Adverse socio-economic conditions including higher rates of poverty and income inequality. 3)Lack of culturally and linguistically appropriate care. 4)Lack of geographically dispersed physicians and medical centers. Source: National Research Council and Institute of Medicine, 2013
Adverse socio-economic conditions including higher rates of poverty and income inequality. 3)Lack of culturally and linguistically appropriate care. 4)Lack of geographically dispersed physicians and medical centers. Source: National Research Council and Institute of Medicine,")
12
Our Fragmented Health Care System Health Insurance Coverage by Source

13
Who’s Typically Uninsured? Part-time workers or working in small firms Those living in poverty and unemployed 18 - 34 years old Latinos are disproportionately uninsured Foreign-born & non-citizens

14
Communities of Color Are More Likely To Be Uninsured California’s Uninsured (Pre-ACA)
")
15
Without Health4All Disparities Will Persist! Communities of color will make up 82% of the uninsured Source: After Millions of Californians Gain Health Coverage after the ACA, Who Will Remain Uninsured?

16
After ACA: Remaining Uninsured After Millions Gain Health Coverage Under the ACA, Who Will Remain Uninsured 2,290,000

17
That’s Why We Need Health4All!

18
Lack of Workforce Diversity

19
Spectrum of Health: Health Coverage Is Just The First Step

20
What does health look like?

21
Quiz Time #2

22
Question : Predictor of Health Q. On average, which one of the following is the best predictor of health in the U.S.? A.Whether or not you smoke? B.What you eat C.Whether or not you are wealthy D.Whether or not you have health insurance E.How often you exercise? Source: “Unnatural Causes…is inequality making us sick?” developed by California Newsreel based in part on a quiz developed by Stephen Bezruchka of Univ. of Wash. Population Health forum

23
Answer C. The single strongest predictor of health is our position on the class pyramid. People in the highest income group can expect to live 6 ½ years longer than those in the lowest. Low-income adults are 50% more likely to suffer from heart disease than top earners. Children living in poverty are ~7 times as likely to be in poor or fair health than children living in high-income households. Source: “Unnatural Causes…is inequality making us sick?” developed by California Newsreel based in part on a quiz developed by Stephen Bezruchka of Univ. of Wash. Population Health forum

24
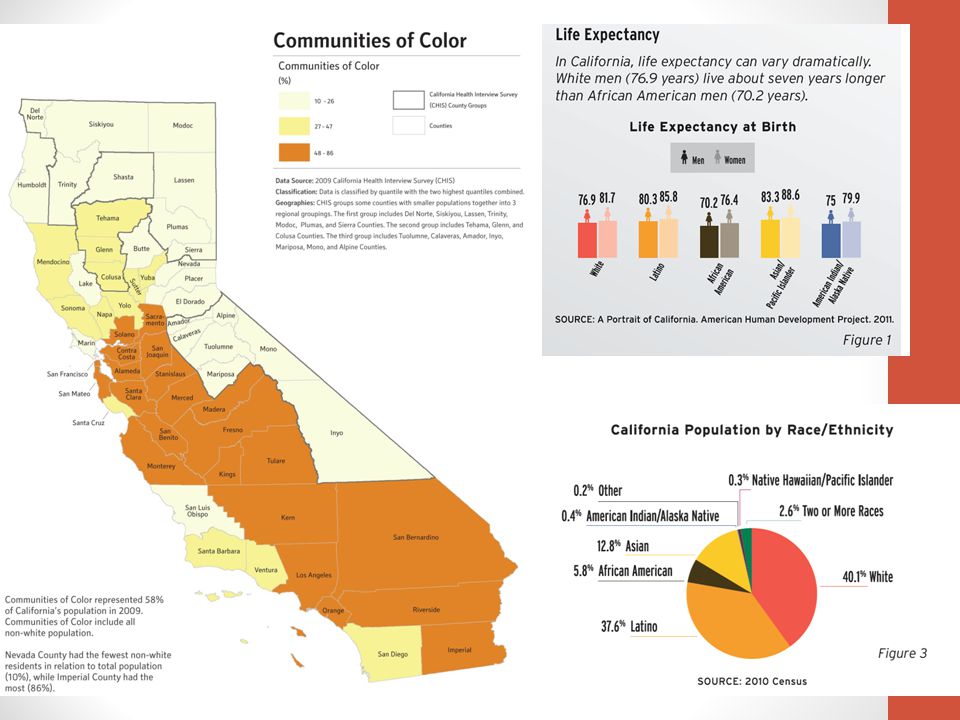
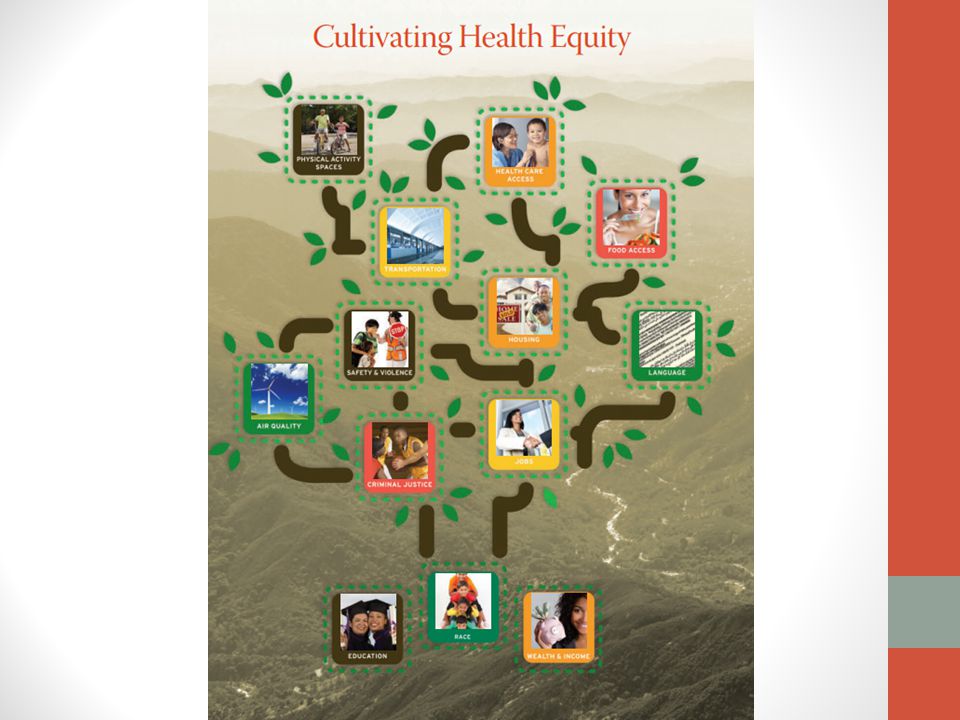
Income and Poverty Source: Landscape of Opportunity: Cultivating Health Equity in California, June 2012 Latinos: $45,185 African Americans: $42,441 American Indians/ Alaskan Native: $41,516 Whites: $66,638 Income Latinos: 10% African Americans: 11% American Indians/Alaska Natives: 13% Whites: 7% Poverty

25
Health Inequities Inequities in the form of… Housing segregation Employment discrimination Unequal wages and other discriminatory practices …have created persistent health disparities that lead to poorer health outcomes and limit opportunities for communities of color in our state.

26
What do we do about that? Promote Health Equity: Ensure all people have full and equal access to opportunities that enable them to lead healthy lives. Eliminate Health Disparities: Differences in health and mental health status among distinct segments of the population, including differences that occur by gender, age, race or ethnicity, sexual orientation, gender identity, education or income, disability or functional impairment, or geographic location, or the combination of any of these factors.

27
Examples of Health Disparities Latinos and Asians in Medi-Cal are more likely to be overweight. Persons that speak English not well or at all are more likely to be diagnosed with heart disease.

28
Examples of Health Disparities

31
Environmental Factors Communities of color and low- income communities are more likely to live in areas with high exposure to pollutants which can lead to higher levels of asthma and other respiratory conditions. Residents in low-income areas and communities of color are often less likely to own a car, so they may rely more on public transportation to go to work, the doctor, or the grocery store.

32
Access to Healthy Fruits and Vegetables In California, people of color have a higher ratio of less healthy food outlets to healthier food outlets. Areas with higher ratios tend to have higher rates of obesity and diabetes.

33
Access to Safe Places to Play A higher percentage of Whites feel safe in their neighborhood compared to communities of color. Not feeling safe in one’s neighborhood is correlated with increased psychological stress. Living in a neighborhood that is perceived to be unsafe creates barriers to physical activity and social cohesion.

35
Policy Solutions Improve the quality of care and utilization of services. Expand workforce to matches the needs of the population. Ensure our communities promote health and wellness. Expand access to all Californians regardless of ability to pay or immigration status.

36
Support Health4All!!!

37
For More Information: (510) 832-1160 info@cpehn.org www.cpehn.org
")
Similar presentations