Download presentation
Presentation is loading. Please wait.

1
The Impacts of large scale climate variability on Northwest climate and salmon Nate Mantua, Ph.D. Climate Impacts Group University of Washington Portland, OR September 21, 2004

2
Warm and cool (or “wet” and “dry”) halves of the year: oct-mar versus apr- september NW climate varies over multiple time frames: year-to-year decade-to-decade century long trends
 halves of the year: oct-mar versus apr- september NW climate varies over multiple time frames: year-to-year decade-to-decade century long trends")
3
El Niño La Niña

4
Equatorial Ocean Temperature deviations from the long-term average: 1982-September 2004 82/83 86/87/88 91/92 97/98 02/03 EN 93 94/95 LN

6
Coastally trapped internal ocean waves from the tropics

7
El Niño/La Niña and NW salmon habitat El Niño winters: intense Aleutian Low low streamflows weak trade winds, coastally trapped warm water currents warmed, strongly stratified upper ocean La Niña winters: weak Aleutian Low high streamflows intense trade winds, coastally trapped cold water currents cooled, weakly stratified upper ocean

8
The Pacific Decadal Oscillation an El Niño-like pattern of climate variability 20 to 30 year periods of persistence in North American and Pacific Basin climate warm extremes prevailed from 1925-46, and again from 1977-98; a prologed cold era spanned 1947-76 mechanisms and predictability areunknown mechanisms and predictability are unknown 1999 192519471977

9
Annual Temperature Trends, (°C / century) 1901-1999 Source: P. Jones, et. al. 2000. PNW average temperatures have risen +1.5F/century

10
decrease increase Trends in April 1 Snowpack (“snow-water-equivalent) 1950-2000 Relative to 1950 value 73% – trends Large – trends PNW Some + trends SW Image courtesy of Phil Mote, UW Climate Impacts Group
 Relative to 1950 value 73% – trends Large – trends PNW Some + trends SW Image courtesy of Phil Mote, UW Climate Impacts Group")
11
As the West warms, winter flows rise and summer flows drop Figure by Iris Stewart, Scripps Inst. of Oceanog. (UC San Diego)
.")
13
A North-South Inverse Production Pattern PC scores 34% variance Mantua et al 1997 Hare, Mantua, and Francis 1999 Gargett 1997 “Optimal Stability Window” r(pdo) =.73 r(niño34) =.53
 =.73 r(niño34) =.53")
14
OPI (hatchery) coho marine survival Why? Leading hypothesis: changes in ocean conditions impact the entire marine food-web

15
upwelling food webs in our coastal ocean: the California Current Cool water, weak stratification high nutrients, a productive “subarctic” food-chain with abundant forage fish and few warm water predators Warm stratified ocean, few nutrients, low productivity “subtropical” food web, a lack of forage fish and abundant predators

16
Upwelling impacts: August 2000 temperatureChlorophyll For the NW coastal ocean, spring/summer upwelling is a key and highly variable process that structures the coastal ocean food web Columbia River Rivermouth

17
Sept 1997 El Niño Sept 1998 La Niña Environmental variability can be large

18
“Newport Line” (central Oregon coast) upper ocean temperatures Depth in meters A thick layer of warm (low density) water at the surface can cut off the nutrient supply… Upwelling without nutrients yields no benefits to phytoplankton! April 1983 April avg 1962-71

19
Newport Line temperatures at depth: from hot to cold April 1998 April 1999 April 1983 April 1962-71 Figure obtained from: http://ltop.coas.oregonstate.edu/~ctd/

20
1000 smolts 10’s to 100’s post-smolts early summer A few to ~100 adults in 2nd summer key factors? Stratification spring transition date spring winds, upwelling and transport ? 1st spring at sea 1st winter at sea key factors? Stratification winter winds, downwelling and transport ? coastal ocean impacts on coho marine survival (Logerwell et al. 2003, Fish. Oceanogr.)
.")
21
4 index Ocean Conditions Model “hindcasts” for OPI coho marine survival, 1969-1998 Logerwell et al. 2003, Fish. Oc. R 2 =.75

22
“Ocean Conditions Model” hindcasts for 1948-1968Washington-Oregon-California coho landings Catch in millions of coho 2 4 6 OPI survival rate (%) 2 4 6 8 10 Ocean conditions appear to be an important piece of the OPI hatchery coho story; they may or may not explain an important part of 48-68 coho landings.
 Ocean conditions appear to be an important piece of the OPI hatchery coho story; they may or may not explain an important part of coho landings.")
23
Life Cycle Modeling for NW coho (Lawson et al. 2004, CJFAS) Link climate impacts on life cycle survival rates in both freshwater and marine environments –For Oregon coast coho “good” stream conditions are correlated with “good” ocean conditions
 Link climate impacts on life cycle survival rates in both freshwater and marine environments –For Oregon coast coho good stream conditions are correlated with good ocean conditions.")
24
summary NW climate varies in part due to the influences of El Nino/La Nina, PDO, and global warming –Other causes remain unnamed, some of which are not likely predictable NW salmon are clearly sensitive to climate induced changes in stream and ocean conditions –changes in NW climate can cause simultaneous negative or positive impacts in stream and ocean conditions warmer temperatures are typically bad news in both environments, cooler temperatures are typically good news Future climate isn’t likely to be like past climate – we are developing tools to examine the hydrologic impacts of climate warming

25
Recent climate events

26
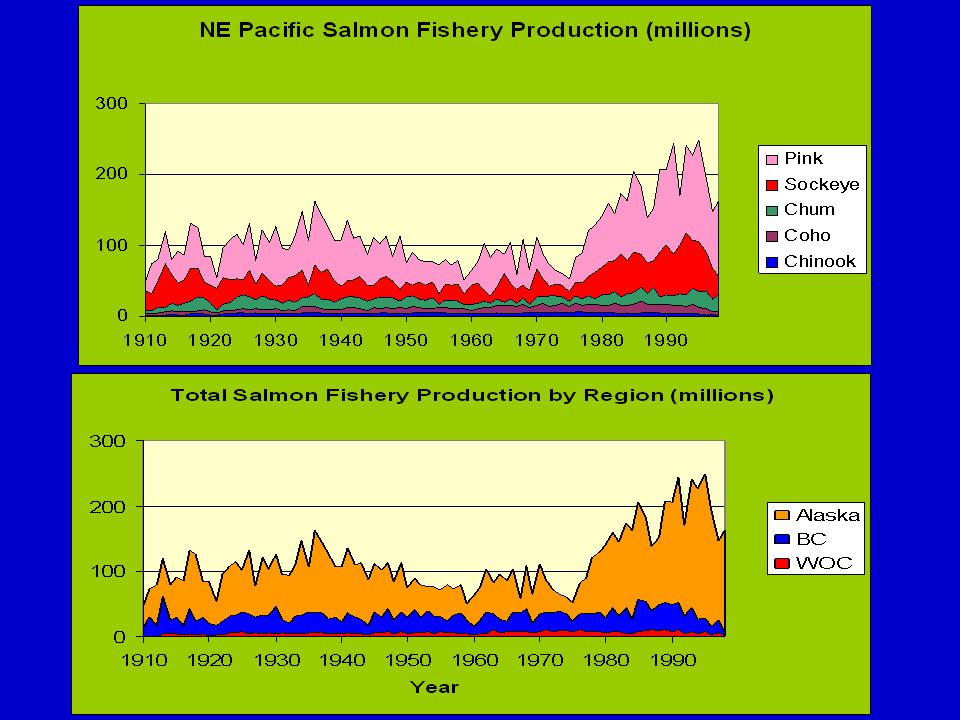
A North-South see-saw in salmon production Warm PDOCool PDOWarm PDO ??? Cool PDO spring chinook returns to the Columbia River mouth (1000s) Alaska pink and sockeye catch (millions)
 Alaska pink and sockeye catch (millions).")
27
Wintertime SST anomaly patterns: from 1990-97, a warm north Pacific did not match the PDO pattern of the past cooler period from 1999-2002 also differed from PDO pattern 1990-97 1999-02 2003

28
Ocean temperature anomalies August 15-September 11, 2004

29
August 2004 ocean temperatures

30
OPI coho GAM data for 2004 smolts Coho SAR JFM 2004 SST =10.5C SpTr 2004 Day 109 Neah Bay SL=-117mm JFM 2005 ~ 10-11 C?

31
Looking to the future… “global climate system models” now used to assess the impacts of human activities on Earth’s climate –Similar to the computer models used to predict the weather, but much more sophisticated –simulate interactions between the atmosphere, its constituents (C02, O2, O3, N2 …), the ocean, sea ice, vegetation, and clouds
, the ocean, sea ice, vegetation, and clouds")
32
~1.5 to 3°C or ~ 3 to 6 °F warmer in the 2040’s Most models also simulate slightly wetter winters

Similar presentations