Download presentation
Presentation is loading. Please wait.

3
How can a dot be used to show different sized populations?

4
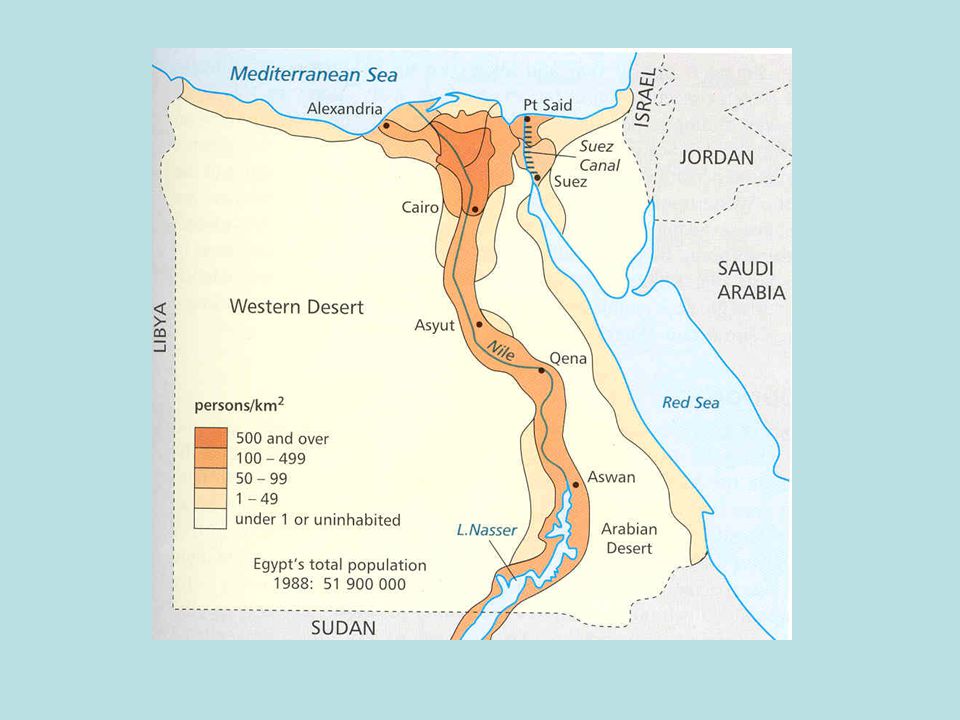
Dot Map - Population Distribution

6
Distribution: Describes the way in which people are spread over the Earth’s surface. It is uneven and there are often considerable changes over time. Technique : Dot map. A dot represents a given number of people e.g. concentration of people next to the Nile valley in Egypt. Has disadvantages of suggesting there are no people away from this area. (In reality there is but insufficient to warrant a dot) So value of dot is important but beware of limitations. Dots merge when population densities are very high making it impossible to estimate the population. Dots merge when population densities are very high making it impossible to estimate the population. What are the advantages of this technique? How can this technique be improved?
 So value of dot is important but beware of limitations. Dots merge when population densities are very high making it impossible to estimate the population. Dots merge when population densities are very high making it impossible to estimate the population. What are the advantages of this technique. How can this technique be improved .")
8
Choropleth Map

9
Choropleth Map-Population Density

13
Population Density of Japan

14
Physical Map of Japan

15
Proportional Symbol Map A Proportional Circle map uses different sizes of circles to represent different amounts of people. The radius is proportional to the number of people being represented.

16
The number of people per unit area. Usually as a square KM. Calculated by dividing the total population by the land area. Usually shown on a Choropleth map also can use a depth map. Population density = population / area Units = People per km 2 Easy to read Numerical values can be read off the map. Population density provides a useful means for comparing population distribution and does show a general pattern of dense, moderate and sparse areas. Advantages

17
Global is generally physical constraints and local is often economic, political and social factors. Can hide concentrations of people e.g. suggesting that Egypt is easily distributed across the country High and low concentrations of population are often hidden as an average is being used. High and low concentrations of population are often hidden as an average is being used. The larger the spatial unit areas used, the more generalisation there is. For example: By colouring Brazil one colour it indicates that population densities throughout Brazil are the same. The larger the spatial unit areas used, the more generalisation there is. For example: By colouring Brazil one colour it indicates that population densities throughout Brazil are the same. If two adjacent areas have different colours it indicates that there is a sudden change in density at the boundary, however changes in population are usually gradual and gentle. If two adjacent areas have different colours it indicates that there is a sudden change in density at the boundary, however changes in population are usually gradual and gentle. Disadvantages

18
Task Task: Describe the distributon of the world’s population. (say what you see) Refer to compass direction, lines of latitude, continental areas, terms such as coastal etc and place names. almost uninhabitedless than 1 person/km 2 sparsely populated / lightly populated 1 to 49 person /km 2 moderately populated50-99 person /km 2 densely populatedover 100 person /km 2 How to Describe Population Densities The following is useful when describing population densities:
 Refer to compass direction, lines of latitude, continental areas, terms such as coastal etc and place names. almost uninhabitedless than 1 person/km 2 sparsely populated / lightly populated 1 to 49 person /km 2 moderately populated50-99 person /km 2 densely populatedover 100 person /km 2 How to Describe Population Densities The following is useful when describing population densities:.")
19
Land accounts for 30% of the world’s surface but only 11% of this has no serious limitations to settlement and agriculture. Much consists of desert, ice, snow, high or steep mountains and forest. NegativePositive Mountains, deserts, rainforest, ice, harsh climate etc. Flat land, ores, ports, tourist areas etc, preferable climate good for farming etc

20
Think of 5 possible reasons why these places are DENSELY or SPARSELY populated? Photo 1 Photo 2

21
Where in the world? ABC FED

22
To map the information on page 346 on an A3 map. You will need to use an Atlas. First read the information and note down the areas which you will label. Use two colours to shade either sparse or dense populations. Name the countries or places. Annotate to show the factors which account for either sparse or dense populations. Use bullet point and extended annotations. You will need to conduct research from the internet Task

23
Task e.g.s Coastal Japan Honshu-Tokyo Flat lowland or undulating areasFlat lowland or undulating areas Easy to cultivate, irrigate, construct buildingsEasy to cultivate, irrigate, construct buildings & roads. Pull factors attract people to cities e.g. Jobs, entertainment etcPull factors attract people to cities e.g. Jobs, entertainment etc Nile Delta Deep, nutrient rich fertile soilsDeep, nutrient rich fertile soils Higher crop yields can be grown.Higher crop yields can be grown. Flat LandFlat Land Reliable supply of waterReliable supply of water River help communicationRiver help communication Himalayas High AltitudeHigh Altitude Rugged terrain makes communications and building difficultRugged terrain makes communications and building difficult Sub Zero temps therefore cannot grow cropsSub Zero temps therefore cannot grow crops

24
Tasks: Read through the different factors which create dense areas and staple into your book. Complete the summary sheets on sparse areas and staple into your books.

25
Population - Topological Map

26
A topological map uses different areas to represent population distribution. Each country is represented by a certain size of rectangular shape. The area of the shape is proportional to its total population. The map is only accurate with respect to the population. The map has to be stretched because of the relative positions of each country, ignoring the actual shape and area of each country.

27
Terms Environmental=is the natural or physical surroundings where people, plants and animals live. The environment is a state of constant change due to the range of forces acting upon it. Historical=events that have happened in the past in the area of or relating to the shared knowledge and values of a society; "cultural roots“ Cultural= of or relating to the shared knowledge and values of a society; "cultural roots“ Social = Effects on people’s lives Political=the means by which the government/administration can influence where people live.

28
To produce a choropleth map of Western Europe. CountryPopulation density per sq.km CountryPopulation density per sq.km Austria7.61/84,000Luxembourg.37 Belgium9.92/31,000Netherlands14.76/37,000 Denmark5.13/43,000Norway4.20/324,000 Finland4.95/338,000Portugal10.41/92,000 France55.87/544,000Spain39.05/505,000 Germany77.87/357,000Sweden8.44/450,000 Greece10.01/132,000Switzerland6.62/41,000 Ireland3.54/70,000UK57.08/245,000 Italy57.44/301,000 Important, the fist number is in millions so Austria’s popultion is 7.61 million Task

29
Important Points when drawing a Choropleth map and Key Each coloured area shows the average or mean population for that area. A graded colour key (between 4 & 7 colours) is used to show different population densities. Less than 4 and the map is too generalised. More than 7 and the patterns become too difficult to identify Dark colours represent densely populated areas. Light colours represent sparsely populated areas If smaller spatial units are used a more accurate map can be produced.
 is used to show different population densities. Less than 4 and the map is too generalised. More than 7 and the patterns become too difficult to identify Dark colours represent densely populated areas. Light colours represent sparsely populated areas If smaller spatial units are used a more accurate map can be produced..")
31
World Population Distribution by Major Areas

32
Projecting the world’s Population

34
Population Density of Brazil

35
Task 1. Draw and annotate a map of Brazil showing density and distribution. 2. a)Describe population distribution of Brazil b) Explain variations in terms of environmental, historical, cultural and political factors.
Describe population distribution of Brazil b) Explain variations in terms of environmental, historical, cultural and political factors..")
36
Conclusion Distributions and Densities vary considerably over the globe. At the global scale the distribution of people is affected by physical factors. At the regional scale the distribution of people is affected by economic, social and political factors. Normally there will be a variety of reasons why an area has a high or low population density.

Similar presentations