Download presentation
Presentation is loading. Please wait.

1
Dose-response Explorer: An Open-source-code Matlab-based tool for modeling treatment outcome as a function of predictive factors Gita Suneja Issam El Naqa, Patricia Lindsay, Andrew Hope, James Alaly, Jeffrey Bradley, Joseph O. Deasy Supported by NIH grant R01 CA 85181

2
What is DREX? An open-source-code Matlab-based tool for:
Modeling tumor control probability (TCP) and normal tissue complication probability (NTCP) Evaluating robustness of models Graphing the results for purposes of outcomes analysis for practitioners, training for residents, and hypothesis-testing for further research
 and normal tissue complication probability (NTCP) Evaluating robustness of models. Graphing the results for purposes of outcomes analysis for practitioners, training for residents, and hypothesis-testing for further research.")
3
Motivation & Objectives
Cornerstone of treatment planning is the need to balance tumor control probability (TCP) with normal tissue complication probability (NTCP) Objective Physicians and scientists need a tool that is straightforward and flexible in the study of treatment parameters and clinical factors We are concerned with the quality of the dose distribution and the radiobiological effects of treatment of the patient
 with normal tissue complication probability (NTCP) Objective. Physicians and scientists need a tool that is straightforward and flexible in the study of treatment parameters and clinical factors. We are concerned with the quality of the dose distribution and the radiobiological effects of treatment of the patient.")
4
Features Analytical modeling of normal tissue complication probability (NTCP) and tumor control probability (TCP) Combination of multiple dose-volume variables and clinical variables using multi-term logistic regression modeling Manual selection or automated estimation of model parameters Estimation of uncertainty in model parameters Performance assessment of univariate and multivariate analysis Capacity to graphically visualize NTCP or TCP prediction vs. selected model variable(s) Quantitative analysis of models – rank correlations, area under ROC Qualitative analysis of models – graphical representations
 Quantitative analysis of models – rank correlations, area under ROC. Qualitative analysis of models – graphical representations.")
5
Basic Modules Data Input 1 2 3 Logistic regression 4
Radiobiological model? 2 TCP NTCP Model type? 3 Model type? Analytical Multi-metric Analytical Poisson or Linear quadratic Logistic regression Lyman-Kutcher-Burman (LKB) or Critical volume 4 Data input (dose-volume and clinical data) – dBase; reserved fields are dBase.dvh, .output, .TimeAxis, .PatientStatus Analytic models – based on biophysical understanding of what happens to tumor cell undergoing radiation Multimetric models – phenomenological and depend on clinical data Logistic regression – with manual or automated parameter estimation Univariate/multivariate performance assessment – using correlations, survival and ROC curves Graphical representation – scatter, contour, histogram, and octile plots Univariate/multivariate performance assessment Graphical representation 5 Export output
 or Critical volume. 4. Data input (dose-volume and clinical data) – dBase; reserved fields are dBase.dvh, .output, .TimeAxis, .PatientStatus. Analytic models – based on biophysical understanding of what happens to tumor cell undergoing radiation. Multimetric models – phenomenological and depend on clinical data. Logistic regression – with manual or automated parameter estimation. Univariate/multivariate performance assessment – using correlations, survival and ROC curves. Graphical representation – scatter, contour, histogram, and octile plots. Univariate/multivariate performance assessment. Graphical representation. 5. Export output.")
6
Modeling Method I: Analytical
NTCP Lyman-Kutcher-Burman (LKB) Model (Lyman 1985, Kutcher and Burman 1989) Critical Volume Model (Niemierko and Goitein 1993) TCP Poisson Statistics Linear-quadratic (LQ) Prediction
 Model (Lyman 1985, Kutcher and Burman 1989) Critical Volume Model (Niemierko and Goitein 1993) TCP. Poisson Statistics. Linear-quadratic (LQ) Prediction.")
7
Modeling Method II: Multimetric
Logistic regression – additive sigmoid model Two types of data exploration Manual Automated Determining Model Order by Leave-one-out-Cross-Validation (Ref.: “Multi-Variable Modeling of Radiotherapy Outcomes: Determining Optimal Model Size,” Deasy et al., poster SU-FF-T-376 ) Model parameters estimated by forward selection on multiple bootstrap samples
 Model parameters estimated by forward selection on multiple bootstrap samples.")
8
Performance Assessment
Spearman’s Rank Correlation Area under the Receiver Operating Characteristic (ROC) curve Survival analysis using the Kaplan-Meier estimator Spearmans – measures the association between different model variables and endpoint outcome, and the correlation between the predicted and observed outcomes; important in treatment plan ranking ROC – graphs of the true positive fraction (sensitivity) vs. the false positive fraction (1- specificity) for a continuum of threshold values: Az=1 is ideal, while Az<0.5 is a random guess Kaplan-Meyer estimator – measures the different in survival between several cutpoints using log-rank correlations8
 curve. Survival analysis using the Kaplan-Meier estimator. Spearmans – measures the association between different model variables and endpoint outcome, and the correlation between the predicted and observed outcomes; important in treatment plan ranking. ROC – graphs of the true positive fraction (sensitivity) vs. the false positive fraction (1- specificity) for a continuum of threshold values: Az=1 is ideal, while Az<0.5 is a random guess. Kaplan-Meyer estimator – measures the different in survival between several cutpoints using log-rank correlations8.")
9
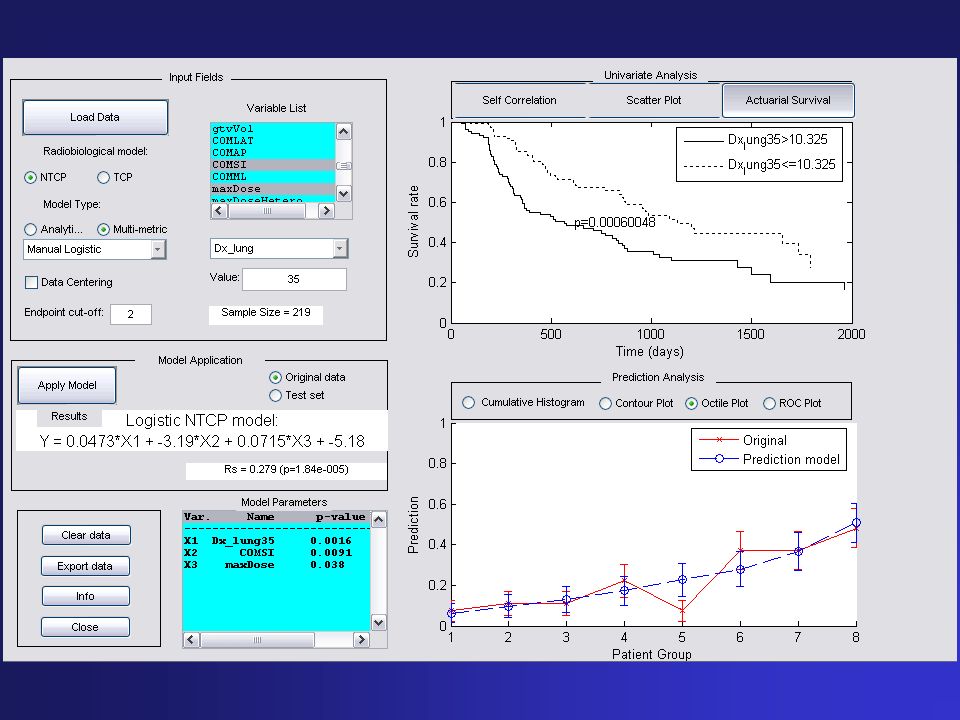
Univariate Graphical Representations
Graph/Plot Description/Function Self-correlation Color-washed Spearman’s cross-correlation image of selected variables and observed outcome Scatter User selects abscissa and ordinate variables Provides user with visual cues about the discrimination ability of certain factors Survival curves Use Kaplan-Meier estimates Scatter plot – provides user with visual cues about the discrimination ability of certain factors

10
Multivariate Graphical Representations
Graph/Plot Description/Function Histogram Cumulative plot of observed response (bar graph) and model-predicted response (line graph) Contour Demonstrates the effect of the model variables on shaping the predicted outcome Octile Patients are uniformly binned into 8 groups Helps visualized goodness of fit of model ROC Assess prediction power of model
 and model-predicted response (line graph) Contour. Demonstrates the effect of the model variables on shaping the predicted outcome. Octile. Patients are uniformly binned into 8 groups. Helps visualized goodness of fit of model. ROC. Assess prediction power of model.")
15
Conclusions User-friendly software tool to analyze dose response effects of radiation Incorporates treatment and clinical factors, as well as biophysical models Various graphical representations Available in the near future on the web at radium.wustl.edu/DREX

Similar presentations


 Hajime Uno (Kitasato University) Tianxi Cai, Els Goetghebeur,>")

. What is cancer? Failure of the mechanisms that control growth and proliferation of the cells Uncontrolled (often rapid) growth.>")


