Download presentation
Presentation is loading. Please wait.

1
Renewable Energy Integration
The Only Real Sensible Approach must be done a resource optimized regional level

2
Overall Focus Current and future sources of energy
What’s best in terms of most efficient combination of capital cost, land use, ecological footprint, material use. Distributed Generation How to improve the Grid Local Energy Storage

3
The Business as Usual Trajectory
BP website (BP.com)
")
4
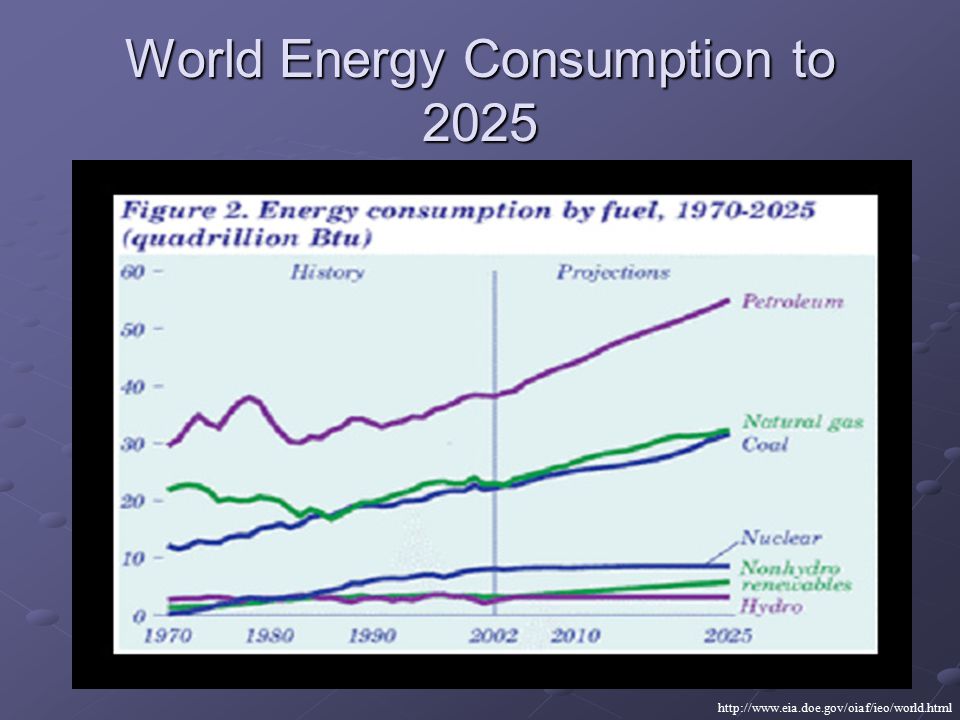
World Energy Consumption to 2025
5
Primary energy consumed per capita
BP website (BP.com)
")
6
Global Fossil Carbon Emissions
Wikipedia.org, Climate Change, Global Warming articles

7
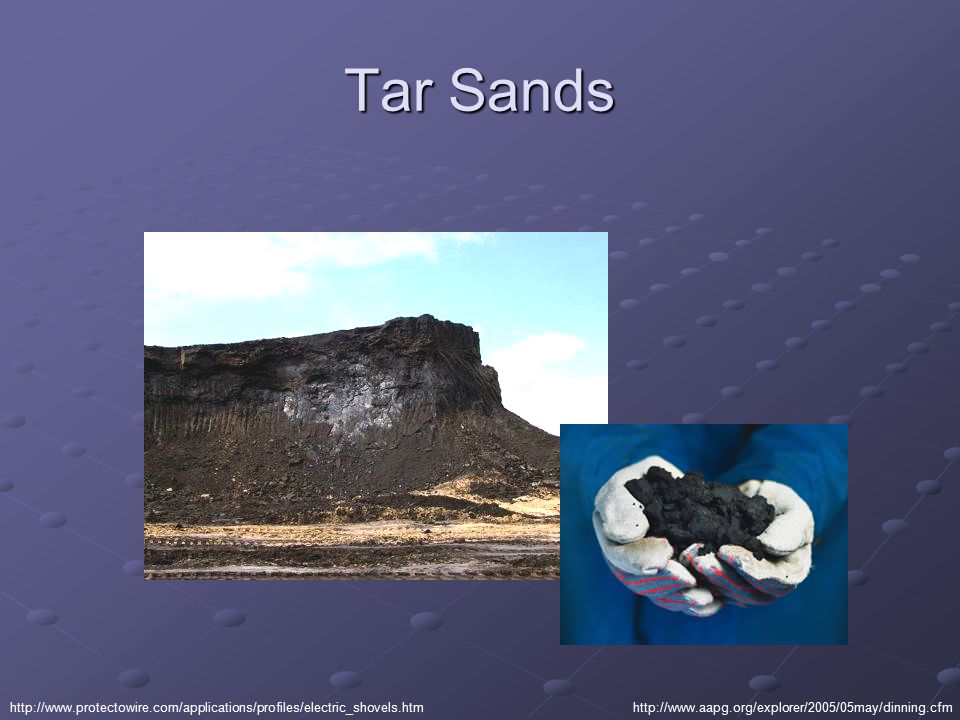
And if we require continued Fossil Fuel usage as transport fuel then
Alternatives to Crude Oil must be used These alternatives will do incredible environmental damage due to the great inefficiency involved in extracting a barrel of oil. And of course, Coal remains the choice for producing the bulk of electricity

8
Tar Sands
9
Oil Shale

10
Typical Coal-Fired Power Plant
Category Power Plant 100W Light Bulb Power 500 MW 100 W Energy / year 3.5 billion kWh 876 kWh Coal / year 1.43 million tons 714 lbs Sulfur Dioxide / year 10,000 Tons 5 pounds Nitrogen Oxides / year 10,200 Tons 5.1 pounds Carbon Dioxide / year 3,700,000 Tons 1,852 pounds

11
CO2 Mitigation Options

12
Carbon Sequestration Options
Developing Cleaner Coal Technologies Carbon sequestration is a family of methods for capturing and permanently isolating carbon dioxide. Sequestration of carbon dioxide emissions from coal could help retain coal’s strategic value as a low-cost, abundant, domestic fuel. The 2006 Budget provides $286 million for the President’s Coal Research Initiative to improve the environmental performance of coal power plants by reducing emissions and improving efficiency. This includes $68 million for the Clean Coal Power Initiative, of which $18 million is allocated to continue development of the FutureGen coal-fueled, zero-emissions, electricity and hydrogen generation project announced by the President in February FutureGen is guided by an industry and international partnership that will work cooperatively on research, development, and deployment of technologies that will dramatically reduce air pollution from coal-fueled electricity generation plants, generate hydrogen, and capture and store greenhouse gas emissions. The Budget ensures that unexpended funds available from prior years’ clean coal projects are available to fund future clean coal activities, beginning with FutureGen. The Budget also increases funding for research and development of other clean coal technologies, such as Integrated Gasification Combined Cycle systems, carbon sequestration, and next-generation turbines.

13
Ocean Sequestration One of the most promising places to sequester carbon is in the oceans, which currently take up a third of the carbon emitted by human activity, roughly two billion metric tons each year. The amount of carbon that would double the load in the atmosphere would increase the concentration in the deep ocean by only two percent. Two sequestration strategies are under intense study at the Department of Energy's Center for Research on Ocean Carbon Sequestration (DOCS), where Jim Bishop of Berkeley Lab's Earth Sciences Division is codirector with Livermore Lab's Ken Caldeira. One is direct injection, which would pump liquefied carbon dioxide a thousand meters deep or deeper, either directly from shore stations or from tankers trailing long pipes at sea. "At great depths, CO2 is denser than sea water, and it may be possible to store it on the bottom as liquid or deposits of icy hydrates," Bishop explains. "At depths easy to reach with pipes, CO2 is buoyant; it has to be diluted and dispersed so it will dissolve." What happens to carbon dioxide introduced into the ocean in this way may soon be field-tested in Hawaii. Over a two-week period researchers plan to inject 40 to 60 metric tons of pure liquid CO2 over 2,500 feet deep in the ocean near the Big Island. One variable they will be measuring is acidity. Water and carbon dioxide form carbonic acid, "but once diluted in sea water, carbonic acid is not the dominant chemical species," Bishop says, "because of seawater's high alkalinity and buffering capacity." If calcium carbonate sediments are involved, acidity is even less. "Think of Tums," he suggests. Fertilizing the ocean The other major approach to sequestration is to "prime the biological pump" by fertilizing the ocean. Near the surface, carbon is fixed by plant-like phytoplankton, which are eaten by sea animals; some eventually rains down as waste and dead organisms. Bacteria feed on this particulate organic carbon and produce CO2, which dissolves, while the rest of the detritus ends on the sea floor. "There are areas of the ocean that are rich in nutrients like nitrogen and phosphorus but poor in phytoplankton," says Bishop. "Adding a little iron to the mix allows the plankton to use the nutrients and bloom. The energy for the process is supplied by sunlight. Already commercial outfits are dropping iron filings overboard, hoping to increase fisheries -- meanwhile claiming they are helping to prevent global warming." THE GLOBAL CARBON CYCLE AND THE ROLE OF THE OCEAN In fact, Bishop explains, "if the excess fixed carbon in plants is eaten by fish near the ocean surface, the net effect is no gain. And in every part of the ocean there are open mouths." No one really knows where the carbon trapped by fertilization ends up. In one iron-fertilization experiment in warm equatorial waters, chlorophyll increased 30-fold in a week, and there was increased carbon sedimentation down through 100 meters. But the bloom shortly dissipated, the fate of the carbon in deeper waters wasn't followed, and long-term effects weren't measured. In a more recent experiment in cold Antarctic Ocean waters the plankton bloom persisted much longer. Seven weeks after the experiment ended a distinct pattern of iron-fertilized plankton was still visible from space -- "which means the fixed carbon was still at the surface." Bishop says that "people who want to add iron think the particulate matter will fall straight to the bottom; I have sampled natural plankton blooms, and I have not seen that happen. These guys have a potentially effective method of sequestering carbon, but as yet there is no scientific basis for their claims."
, where Jim Bishop of Berkeley Lab s Earth Sciences Division is codirector with Livermore Lab s Ken Caldeira. One is direct injection, which would pump liquefied carbon dioxide a thousand meters deep or deeper, either directly from shore stations or from tankers trailing long pipes at sea. At great depths, CO2 is denser than sea water, and it may be possible to store it on the bottom as liquid or deposits of icy hydrates, Bishop explains. At depths easy to reach with pipes, CO2 is buoyant; it has to be diluted and dispersed so it will dissolve. What happens to carbon dioxide introduced into the ocean in this way may soon be field-tested in Hawaii. Over a two-week period researchers plan to inject 40 to 60 metric tons of pure liquid CO2 over 2,500 feet deep in the ocean near the Big Island. One variable they will be measuring is acidity. Water and carbon dioxide form carbonic acid, but once diluted in sea water, carbonic acid is not the dominant chemical species, Bishop says, because of seawater s high alkalinity and buffering capacity. If calcium carbonate sediments are involved, acidity is even less. Think of Tums, he suggests. Fertilizing the ocean. The other major approach to sequestration is to prime the biological pump by fertilizing the ocean. Near the surface, carbon is fixed by plant-like phytoplankton, which are eaten by sea animals; some eventually rains down as waste and dead organisms. Bacteria feed on this particulate organic carbon and produce CO2, which dissolves, while the rest of the detritus ends on the sea floor. There are areas of the ocean that are rich in nutrients like nitrogen and phosphorus but poor in phytoplankton, says Bishop. Adding a little iron to the mix allows the plankton to use the nutrients and bloom. The energy for the process is supplied by sunlight. Already commercial outfits are dropping iron filings overboard, hoping to increase fisheries -- meanwhile claiming they are helping to prevent global warming. THE GLOBAL CARBON CYCLE AND THE ROLE OF THE OCEAN. In fact, Bishop explains, if the excess fixed carbon in plants is eaten by fish near the ocean surface, the net effect is no gain. And in every part of the ocean there are open mouths. No one really knows where the carbon trapped by fertilization ends up. In one iron-fertilization experiment in warm equatorial waters, chlorophyll increased 30-fold in a week, and there was increased carbon sedimentation down through 100 meters. But the bloom shortly dissipated, the fate of the carbon in deeper waters wasn t followed, and long-term effects weren t measured. In a more recent experiment in cold Antarctic Ocean waters the plankton bloom persisted much longer. Seven weeks after the experiment ended a distinct pattern of iron-fertilized plankton was still visible from space -- which means the fixed carbon was still at the surface. Bishop says that people who want to add iron think the particulate matter will fall straight to the bottom; I have sampled natural plankton blooms, and I have not seen that happen. These guys have a potentially effective method of sequestering carbon, but as yet there is no scientific basis for their claims.")
14
Nuclear Energy Consumption – a green alternative to fossil emission

15
Transportation Concerns

16
Wind Energy Wind turbines technology generally falls into two categories: small, or distributed turbines that provide power directly to their owner, and large, or utility-scale turbines that provide wholesale power. The small turbines (such as the one of the far right of this page), range from several watts in capacity to kilowatts. The utility-scale turbines range from about 660 kilowatts to 1.8 megawatts. Offshore turbines can be larger, in the 2-megawatt range. A 10-kW turbine has a rotor diameter of 7 meters (23 feet). It is usually mounted on a foot tower, and can produce about 16,000 kWh annually, more than enough to power a typical household. A 1.5-MW turbine has a rotor diameter of meters ( feet). They are typically installed on towers that are at least 65 meters (213 feet) tall. A 1.5-Mw turbine can produce more than 4.3 million kWh per year, enough to power more than 400 average U.S. housesholds.
, range from several watts in capacity to kilowatts. The utility-scale turbines range from about 660 kilowatts to 1.8 megawatts. Offshore turbines can be larger, in the 2-megawatt range. A 10-kW turbine has a rotor diameter of 7 meters (23 feet). It is usually mounted on a foot tower, and can produce about 16,000 kWh annually, more than enough to power a typical household. A 1.5-MW turbine has a rotor diameter of meters ( feet). They are typically installed on towers that are at least 65 meters (213 feet) tall. A 1.5-Mw turbine can produce more than 4.3 million kWh per year, enough to power more than 400 average U.S. housesholds.")
17
US Wind Energy Generation

18
Recent Capacity Enhancements
2006 5 MW 600’ 2003 1.8 MW 350’ 2000 850 kW 265’ Vestas V52 – 850 kW, 52 m rotor diameter, avg. 55 m hub height Vestas V80 – 1.8 MW, 80 m rotor diameter, avg. 67 m hub height REPower Systems 5M – 5 MW, 126 m rotor diameter, up to 120 m hub height Statue of Liberty – 305 feet from ground to torch

19
Costs Nosedive Wind’s Success
38 cents/kWh cents/kWh The cost of producing electricity from wind energy has declined more than 80%, from about 38 cents per kilowatt-hour in the early 80s to a current range of 3 to 6 cents per kilowatt-hour (KWh) levelized over a plant's lifetime. In the not-too-distant future, analysts predict, wind energy costs could fall even lower than most conventional fossil fuel generators, reaching a cost of 2.5 cents per kWh. This dramatic reduction in the cost of energy from wind plants can be attributed largely to technological improvements and economies of scale achieved by manufacturing more and larger wind turbines. This will be discussed in more detail in the following slides. Levelized cost at good wind sites in nominal dollars, not including tax credit
 levelized over a plant s lifetime. In the not-too-distant future, analysts predict, wind energy costs could fall even lower than most conventional fossil fuel generators, reaching a cost of 2.5 cents per kWh. This dramatic reduction in the cost of energy from wind plants can be attributed largely to technological improvements and economies of scale achieved by manufacturing more and larger wind turbines. This will be discussed in more detail in the following slides. Levelized cost at good wind sites in nominal dollars, not including tax credit.")
20
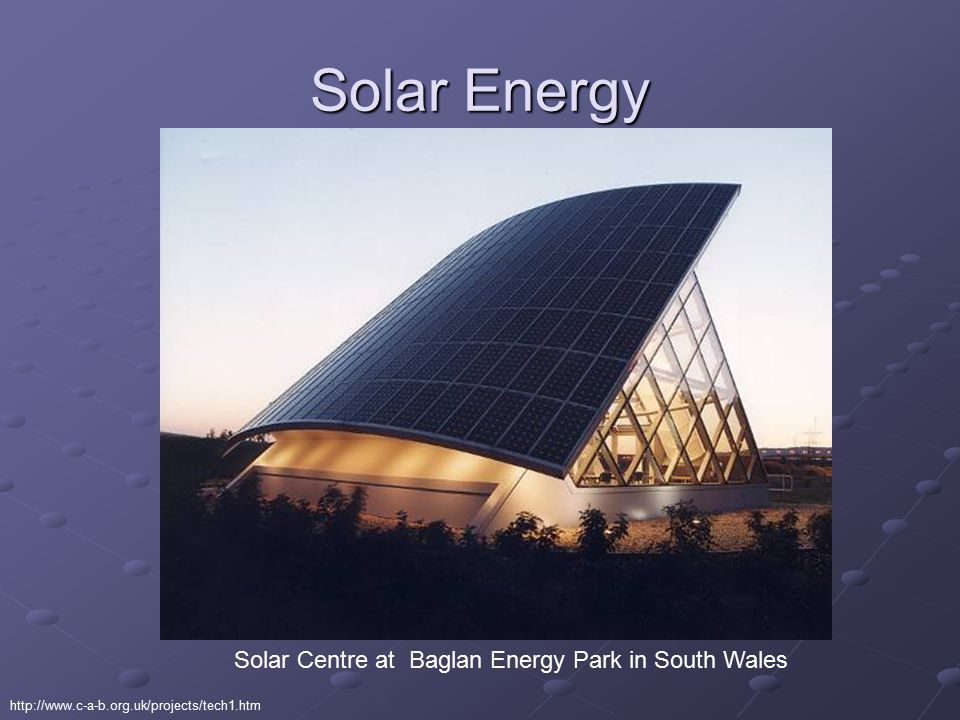
Solar Energy Solar Centre at Baglan Energy Park in South Wales
21
Large Scale Solar – Land Use Issues
A solar panel in Marla, Cirque de Mafate, Réunion Larger solar arrays can provide electricity to habitations in isolated, well-lighted areas

22
Small Scale Solar – yes , yes ,yes

23
Oceanic Energy

24
“Mighty Whale” Design – Japan
Another notable example of an OWC is the “Mighty Whale.” It is the world’s largest offshore floating OWC and was launched in July 1998 by the Japan Marine Science and Technology Center. This prototype, moored facing the predominant wave direction, has a displacement of 4,400 tons and measures 50m long. The Mighty Whale has three air chambers that convert wave energy into pneumatic energy. Wave action causes the internal water level in each chamber to rise and fall, forcing a bi-directional flow over an air-turbine to generate energy. The resulting electricity is supplied mainly to the nearby coastal areas. Storage batteries onboard ensure that electricity is available even during periods of reduced wave activity. It is projected that a row of such devices could be used to supply energy to fish farms in the calm waters behind the devices, and aeration/purification of seawater [7].

25
Ocean Wave Conversion System
This technology builds upon SARA's pioneering Ocean Wave Energy Conversion system, awarded US Patent 5,136,173; Unlike alternative concepts that make use of cumbersome intermediate mechanical stages, SARA's approach uses direct conversion of mechanical fluid energy into electricity, via a highly efficient magnetohydrodynamics (MHD) process. Product: Rapidly-deployable Wave-powered MHD Electric Generator for the US Navy Low-cost commercial power for coastal communities. Benefits: Almost no moving parts. No gears, no levers, no turbines, no drive belts, no bearings, etc. Direct, local, and efficient conversion of fluid motion into electricity, with no intermediate mechanical stages. Highly-compatible with very-strong, but slow-moving, driving forces (ocean waves, for example).
 process. Product: Rapidly-deployable Wave-powered MHD Electric Generator for the US Navy. Low-cost commercial power for coastal communities. Benefits: Almost no moving parts. No gears, no levers, no turbines, no drive belts, no bearings, etc. Direct, local, and efficient conversion of fluid motion into electricity, with no intermediate mechanical stages. Highly-compatible with very-strong, but slow-moving, driving forces (ocean waves, for example).")
26
Geothermal Energy Plant
Geothermal energy plant in Iceland

27
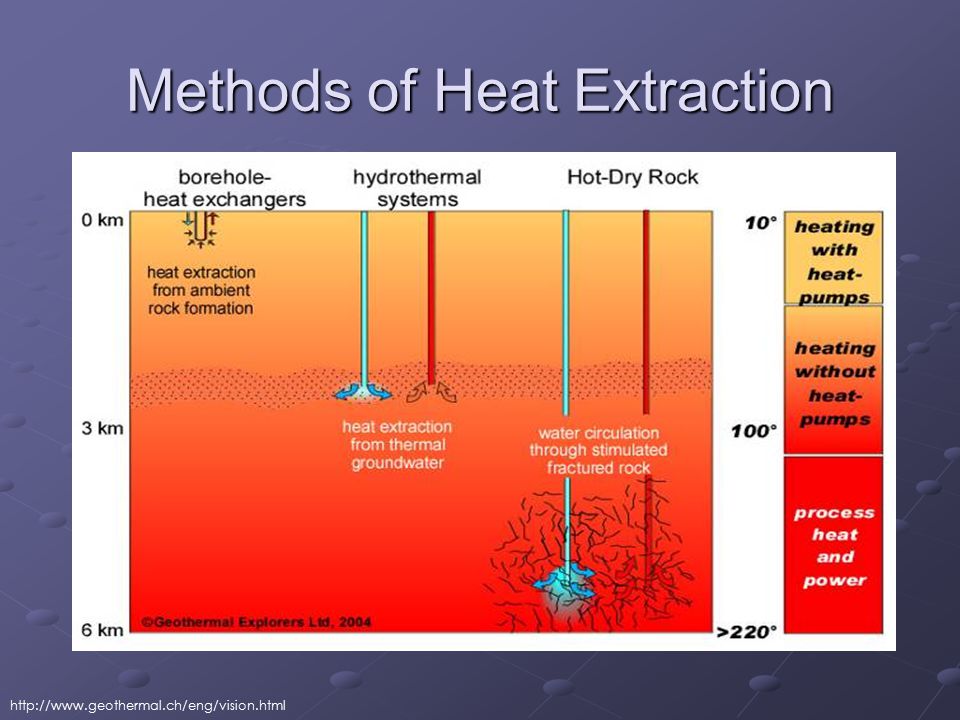
Methods of Heat Extraction
28
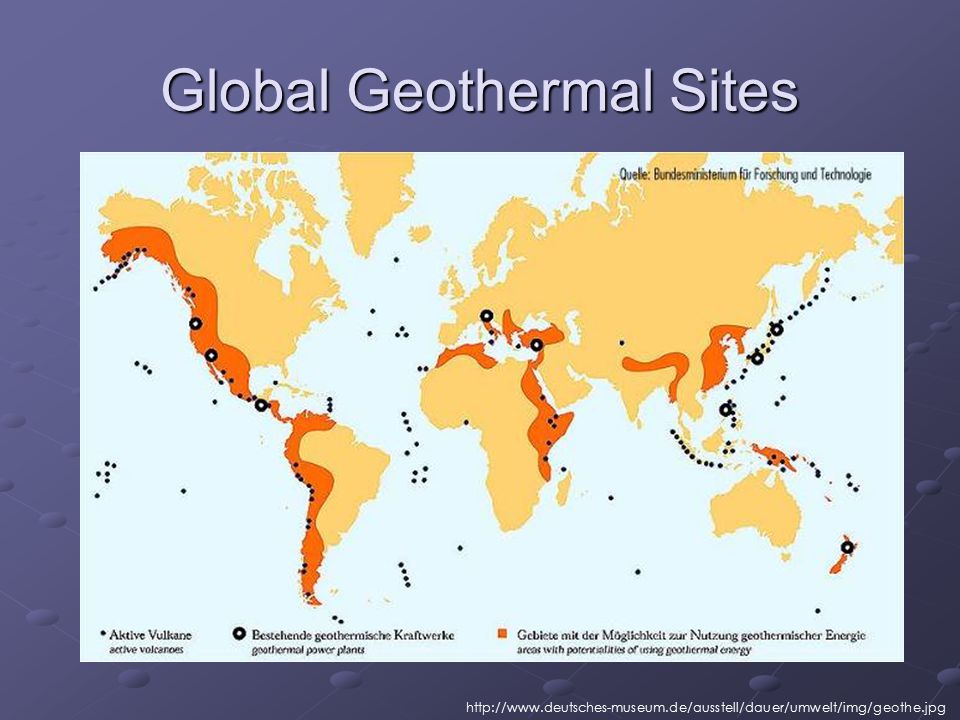
Global Geothermal Sites
29
Bioenergy Cycle

30
Types of Biomass

31
Landfill Gasses Boyle, Renewable Energy, Oxford University Press (2004)
")
32
Hydrogen Economy Schematic
The term “Hydrogen Economy” refers to the infrastructure to support the energy requirements of society, based on the use of hydrogen rather than fossil fuels. The concept of using hydrogen as an energy system is not new; it has previously been used both industrially and domestically (town gas - 50% hydrogen was used in the UK until the 1950's). Interest in hydrogen as a vehicle fuel dates back to the 1800's but heightened in the 1970's with the oil crises and with technological advances in the 1980's. Hydrogen is a good candidate for reducing emissions since when it is reacted with oxygen it produces only water as the reaction product. Hydrogen can be used to provide electricity and heat either through use in a fuel cell or combustion. A fuel cell generates electricity by combining hydrogen with oxygen from air; the only by-product is water. Hydrogen can also be burned in an internal combustion engine in the same way as petrol or natural gas. This produces water as the main by-product, however, small amounts of oxides of nitrogen (air pollutants) are also produced. Unlike oil, gas and coal hydrogen doesn't exist in large quantities in nature in a useful form. Like electricity it is an energy carrier, which must be produced using energy from another source. Hydrogen, however, has the advantage that it can be stored more easily.Today, nearly half the hydrogen produced in the world is derived from natural gas via a steam-reforming process. The natural gas reacts with steam in a catalytic converter. The process strips away the hydrogen atoms, leaving carbon dioxide as the by-product. Therefore, in the future, hydrogen must be produced from renewable energy sources.
. Interest in hydrogen as a vehicle fuel dates back to the 1800 s but heightened in the 1970 s with the oil crises and with technological advances in the 1980 s. Hydrogen is a good candidate for reducing emissions since when it is reacted with oxygen it produces only water as the reaction product. Hydrogen can be used to provide electricity and heat either through use in a fuel cell or combustion. A fuel cell generates electricity by combining hydrogen with oxygen from air; the only by-product is water. Hydrogen can also be burned in an internal combustion engine in the same way as petrol or natural gas. This produces water as the main by-product, however, small amounts of oxides of nitrogen (air pollutants) are also produced. Unlike oil, gas and coal hydrogen doesn t exist in large quantities in nature in a useful form. Like electricity it is an energy carrier, which must be produced using energy from another source. Hydrogen, however, has the advantage that it can be stored more easily.Today, nearly half the hydrogen produced in the world is derived from natural gas via a steam-reforming process. The natural gas reacts with steam in a catalytic converter. The process strips away the hydrogen atoms, leaving carbon dioxide as the by-product. Therefore, in the future, hydrogen must be produced from renewable energy sources.")
33
Transporting Hydrogen

34
One Transition Plan Following the proposal by the Hydrogen Romantics of the Hydrogen Energy System, one of their first actions was to establish the International Association for Hydrogen Energy,IAHE . IAHE was established with the aim of promoting conversion to the Hydrogen Economy by informing the public in general, along with energy and environment scientists and decision makers in particular about the advantages and benefits of the Hydrogen Energy System. In January 1975, IAHE started the publication of its scientific journal, the International Journal of Hydrogen Energy, IJHE, and now publishes some 15 issues a year. Starting in 1976, IAHE began organizing the biennial World Hydrogen Energy Conferences (WHECs). In parallel with the International Association for Hydrogen Energy, a growing number of national hydrogen energy organizations have been established around the world which organize their own publications together with national and regional conferences. During the first quarter century, from 1974 through 2000, utilising the research and development activities in universities and energy related industries, and through information dissemination activities, such as conferences and publications, the foundations of the Hydrogen Energy System were established. By the year 2000, the transition to the Hydrogen Economy had started. In Japan and in the U.S.A., hydrogen fueled cars are available for leasing. In Europe, the Americas and Australia, Rapid Transport Authorities have started operation of fleets of hydrogen fueled buses. Several types of hydrogen fuel cells as well as hydrogen hydride electric batteries are available commercially for electricity generation. Many countries have initiated programmes for roadmaps for conversion to the Hydrogen Economy. However, present modeling studies indicate that if no incentives are provided for clean energy, full transition to the Hydrogen Economy will take three quarters of century. UNITED NATIONS INDUSTRIAL DEVELOPMENT ORGANIZATION INTERNATIONAL CENTRE FOR HYDROGEN ENERGY TECHNOLOGIES
. In parallel with the International Association for Hydrogen Energy, a growing number of national hydrogen energy organizations have been established around the world which organize their own publications together with national and regional conferences. During the first quarter century, from 1974 through 2000, utilising the research and development activities in universities and energy related industries, and through information dissemination activities, such as conferences and publications, the foundations of the Hydrogen Energy System were established. By the year 2000, the transition to the Hydrogen Economy had started. In Japan and in the U.S.A., hydrogen fueled cars are available for leasing. In Europe, the Americas and Australia, Rapid Transport Authorities have started operation of fleets of hydrogen fueled buses. Several types of hydrogen fuel cells as well as hydrogen hydride electric batteries are available commercially for electricity generation. Many countries have initiated programmes for roadmaps for conversion to the Hydrogen Economy. However, present modeling studies indicate that if no incentives are provided for clean energy, full transition to the Hydrogen Economy will take three quarters of century. UNITED NATIONS INDUSTRIAL DEVELOPMENT ORGANIZATION INTERNATIONAL CENTRE FOR HYDROGEN ENERGY TECHNOLOGIES.")
35
Distributed Generation as the New Power Grid

36
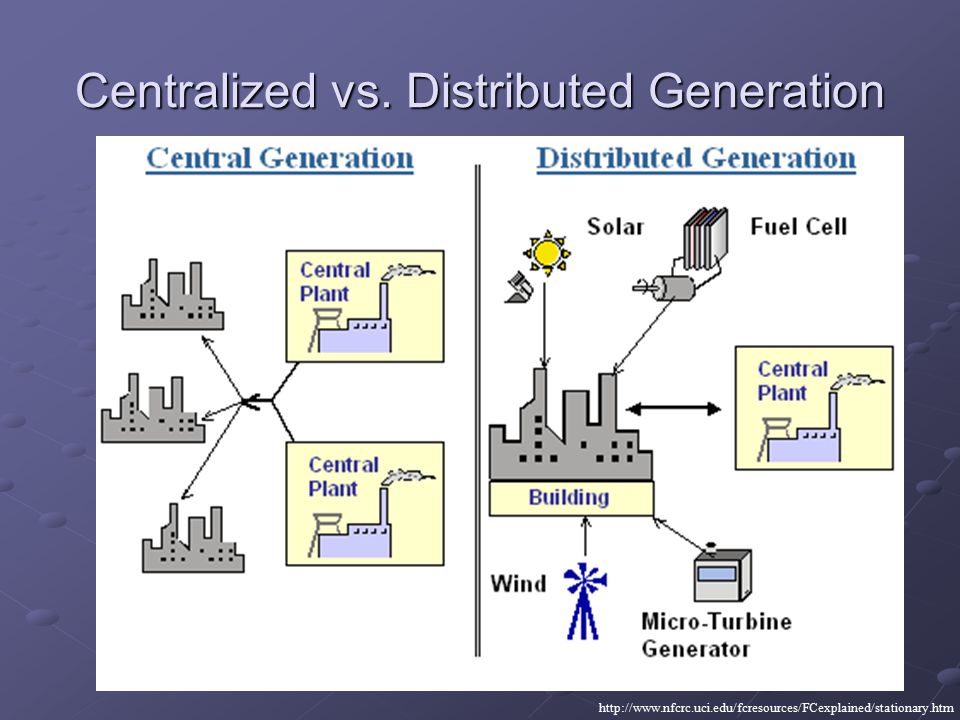
Centralized vs. Distributed Generation
37
Central Power Generation (today)
Remote, Large, Expensive Long Distance Delivery Fossil Fuel Plants Waste Heat (Nuclear) Environment Unfriendly (Co2) Health Unfriendly (Nox, So2, Pm10, Hg) Nuclear Plants Waste Disposal Hydroelectric Plants Flooding Unreliable ( ) 110 Grid Failures Cost $ B./Yr Adds 29-45% To Electric Bill Slide 3 This slide summarizes the characteristics of Central Generation. Large, expensive plants benefit from economy of scale, but there is a price to pay in costs of long distance delivery via the grid, described as the largest machine built by man, now in a sclerotic condition. Fossil Fuel Plants waste heat, as do Nuclear. FF plants are environmentally and health unfriendly, giving off CO2 and polluting gases. Nuclear plants do not generate any of these gases, but nuclear and hydroelectric plants have their own environmental problems. CG plants are unreliable. In the years 2000 to 2003 there were 110 grid failures, 11 of which involved over 0.5 million people. In 2003 the cost of electricity to end users was $272 billion. Grid failures added somewhere between $80 to $123 billion to this bill. Recent hurricanes in Florida cost utilities 1 billion dollars to replace 30,000 poles, transformers and 3,000 miles of wire. CG plants are monopolies, owned privately and by states and municipalities. They are highly regulated, and for many years without competition. One reason for 40 years of no improvement stems from the regulation that all cost-saving improvements must be passed on to the customer. The incentive for improvement and profit is nullified. At the bottom of slide 3 are some adjectives that are used by critics to describe Central Generation. If we are to have a revolution, we should have something in mind that is better, and we do, Distributed Generation. But first, let’s see how a typical coal CG plant works, using the one at Apollo Beach Florida as an example.
 Environment Unfriendly (Co2) Health Unfriendly (Nox, So2, Pm10, Hg) Nuclear Plants. Waste Disposal. Hydroelectric Plants. Flooding. Unreliable ( ) 110 Grid Failures. Cost $ B./Yr. Adds 29-45% To Electric Bill. Slide 3. This slide summarizes the characteristics of Central Generation. Large, expensive plants benefit from economy of scale, but there is a price to pay in costs of long distance delivery via the grid, described as the largest machine built by man, now in a sclerotic condition. Fossil Fuel Plants waste heat, as do Nuclear. FF plants are environmentally and health unfriendly, giving off CO2 and polluting gases. Nuclear plants do not generate any of these gases, but nuclear and hydroelectric plants have their own environmental problems. CG plants are unreliable. In the years 2000 to 2003 there were 110 grid failures, 11 of which involved over 0.5 million people. In 2003 the cost of electricity to end users was $272 billion. Grid failures added somewhere between $80 to $123 billion to this bill. Recent hurricanes in Florida cost utilities 1 billion dollars to replace 30,000 poles, transformers and 3,000 miles of wire. CG plants are monopolies, owned privately and by states and municipalities. They are highly regulated, and for many years without competition. One reason for 40 years of no improvement stems from the regulation that all cost-saving improvements must be passed on to the customer. The incentive for improvement and profit is nullified. At the bottom of slide 3 are some adjectives that are used by critics to describe Central Generation. If we are to have a revolution, we should have something in mind that is better, and we do, Distributed Generation. But first, let’s see how a typical coal CG plant works, using the one at Apollo Beach Florida as an example.")
38
Distributed Generation
Located next to user Range of energy sources Fossil fuel, waste gas, renewables, Hydrogen, nuclear Capacity kw –Mw Economic benefits “Waste” heat used Lowers fossil fuel use Low investment Power failure losses eliminated Environmental/ health costs reduced Grid costs – peak/capital Lower electric bills Flexibility of location Cogeneration Combined heat & power (CHP) Micropower Slide 5 Now back to the energy revolution, Distributed Generation. The key feature is that these plants are located next to the user so that heat generated can be utilized. Many energy sources are used, including waste gases from land fills, renewables and even nuclear. Nuclear is a DG source aboard naval vessels where heat and electricity are utilized. Capacities vary from KW to MW. Using waste heat lowers fossil fuel use. Whereas CG plants benefit from economies of scale, DG plants with low investment costs benefit from economies of mass production. Power failure and environmental health costs are reduced or eliminated. Many DG units are connected to the grid which permits peak-shaving, and adding electrical energy to the grid when DG energy is not needed. In addition, utilities benefit when their grid does not reach a remote area where electricity is needed. It is cheaper to set up a DG unit than to extend the grid. Another advantage of DG is flexibility of location. They can be placed on ski slopes, farms, green houses etc. The Conde Nast building in Times Square uses solar panels and fuel cells to lower electric bills and the new 1776 building planned for ground zero will be fitted with a wind turbine for the same purpose.
 Micropower. Slide 5. Now back to the energy revolution, Distributed Generation. The key feature is that these plants are located next to the user so that heat generated can be utilized. Many energy sources are used, including waste gases from land fills, renewables and even nuclear. Nuclear is a DG source aboard naval vessels where heat and electricity are utilized. Capacities vary from KW to MW. Using waste heat lowers fossil fuel use. Whereas CG plants benefit from economies of scale, DG plants with low investment costs benefit from economies of mass production. Power failure and environmental health costs are reduced or eliminated. Many DG units are connected to the grid which permits peak-shaving, and adding electrical energy to the grid when DG energy is not needed. In addition, utilities benefit when their grid does not reach a remote area where electricity is needed. It is cheaper to set up a DG unit than to extend the grid. Another advantage of DG is flexibility of location. They can be placed on ski slopes, farms, green houses etc. The Conde Nast building in Times Square uses solar panels and fuel cells to lower electric bills and the new 1776 building planned for ground zero will be fitted with a wind turbine for the same purpose.")
39
Sources of DG Solar – photovoltaic and thermal Wind Turbines
Hydroelectric (large scale and micro) Geothermal Oceanic Nuclear Fossil Fuels Combined Heat & Power (CHP) Slide 7 Energy sources and equipment for DG vary, as shown in the top portion of this slide. Combined heat & power equipment using fossil fuels (CHP) has been around for over 30 years. Principles are similar to those used in Apollo Beach. Chemical energy is converted to heat energy to mechanical energy to electrical energy. Microturbines are a fairly recent development, following a pattern that smaller is better, as seen in many other fields. Pre-heated air is mixed with natural gas and combusted. The gases rotate a turbine which drives a compressor which feeds gases to a 2nd turbine which drives a generator producing electricity. Heat developed is used to pre-heat air going in as well as for other useful purposes. These units are the size of a refrigerator and have one moving part (turbine, compressor and generator on a single shaft) They are quiet, clean, can run continuously and are designed to last for 10 years. The technology which made microturbines possible is the development of air bearings that permit revolutions as high as 100,000 rpm.
 Geothermal. Oceanic. Nuclear. Fossil Fuels. Combined Heat & Power (CHP) Slide 7. Energy sources and equipment for DG vary, as shown in the top portion of this slide. Combined heat & power equipment using fossil fuels (CHP) has been around for over 30 years. Principles are similar to those used in Apollo Beach. Chemical energy is converted to heat energy to mechanical energy to electrical energy. Microturbines are a fairly recent development, following a pattern that smaller is better, as seen in many other fields. Pre-heated air is mixed with natural gas and combusted. The gases rotate a turbine which drives a compressor which feeds gases to a 2nd turbine which drives a generator producing electricity. Heat developed is used to pre-heat air going in as well as for other useful purposes. These units are the size of a refrigerator and have one moving part (turbine, compressor and generator on a single shaft) They are quiet, clean, can run continuously and are designed to last for 10 years. The technology which made microturbines possible is the development of air bearings that permit revolutions as high as 100,000 rpm.")
40
Microturbines Low to moderate initial capital cost Fuel flexibility,
burn either gaseous (natural gas, propane, biogases, oil-field flared gas) or liquid fuels (diesel, kerosene) Heat released from burning the fuel also providing heating and cooling needs (CHP Extremely low air emissions NOx, CO, and SOx Continuous operating even during brownout or blackout Microturbines—gas- or liquid-fuel-fired turbine-generator units with an electrical output between 30 and 500 kilowatts—are being used increasingly for 24/7 onsite power generation. And many areas of the world will very likely see a major increase in microturbine-based onsite power generation over the next five to 10 years. A cutaway of a Capstone microturbine. The company's 30 and 60-kilowatt units have just one moving part—a shaft that turns at 96,000 rpm. Since making their commercial debut a mere five years ago, microturbines have been installed with considerable success in office and apartment buildings, hotels and motels, supermarkets, schools and colleges, office and industrial parks, small industries, and numerous other facilities both in the US and abroad. They provide not only electricity, but the thermal energy to provide for all heating and cooling needs. The reasons for the growth in microturbine installations lie in the intrinsic advantages of this technology, including: Low to moderate initial capital cost Fuel flexibility, allowing them to burn either gaseous (natural gas, propane, biogases, oil-field flared gas) or liquid fuels (diesel, kerosene) Heat released from burning the fuel not only generating electricity, but also providing all heating and cooling needs for a facility through cogeneration, combined heat and power (CHP), and combined cooling, heat and power (CCHP) Extremely low air emissions for NOx, CO, and SOx The ability for a facility to continue operating even during a regional power brownout or blackout, offering greater energy reliability __________________________ One of the most striking technical characteristics of micro turbines is their extremely high rotational speed. The turbine rotates up to rpm and the generator up to rpm. Individual units range from kW but can be combined readily into systems of multiple units. Low combustion temperatures can assure very low NOx emissions levels. They make much less noise than an engine of comparable size. Natural gas is expected to be the most common fuel, but landfill gas, or biogas can also be used [1]. The main disadvantages of micro turbines at this stage are its short track record and high costs compared with gas engines A cutaway of a microturbine; 30 and 60-kilowatt units have just one moving part – a shaft that turns at 96,000 rpm.
 or liquid fuels (diesel, kerosene) Heat released from burning the fuel also providing heating and cooling needs (CHP. Extremely low air emissions. NOx, CO, and SOx. Continuous operating even during brownout or blackout. Microturbines—gas- or liquid-fuel-fired turbine-generator units with an electrical output between 30 and 500 kilowatts—are being used increasingly for 24/7 onsite power generation. And many areas of the world will very likely see a major increase in microturbine-based onsite power generation over the next five to 10 years. A cutaway of a Capstone microturbine. The company s 30 and 60-kilowatt units have just one moving part—a shaft that turns at 96,000 rpm. Since making their commercial debut a mere five years ago, microturbines have been installed with considerable success in office and apartment buildings, hotels and motels, supermarkets, schools and colleges, office and industrial parks, small industries, and numerous other facilities both in the US and abroad. They provide not only electricity, but the thermal energy to provide for all heating and cooling needs. The reasons for the growth in microturbine installations lie in the intrinsic advantages of this technology, including: Low to moderate initial capital cost. Fuel flexibility, allowing them to burn either gaseous (natural gas, propane, biogases, oil-field flared gas) or liquid fuels (diesel, kerosene) Heat released from burning the fuel not only generating electricity, but also providing all heating and cooling needs for a facility through cogeneration, combined heat and power (CHP), and combined cooling, heat and power (CCHP) Extremely low air emissions for NOx, CO, and SOx. The ability for a facility to continue operating even during a regional power brownout or blackout, offering greater energy reliability. __________________________. One of the most striking technical characteristics of micro turbines is their extremely high rotational speed. The turbine rotates up to rpm and the generator up to rpm. Individual units range from kW but can be combined readily into systems of multiple units. Low combustion temperatures can assure very low NOx emissions levels. They make much less noise than an engine of comparable size. Natural gas is expected to be the most common fuel, but landfill gas, or biogas can also be used [1]. The main disadvantages of micro turbines at this stage are its short track record and high costs compared with gas engines. A cutaway of a microturbine; 30 and 60-kilowatt units have just one moving part – a shaft that turns at 96,000 rpm.")
41
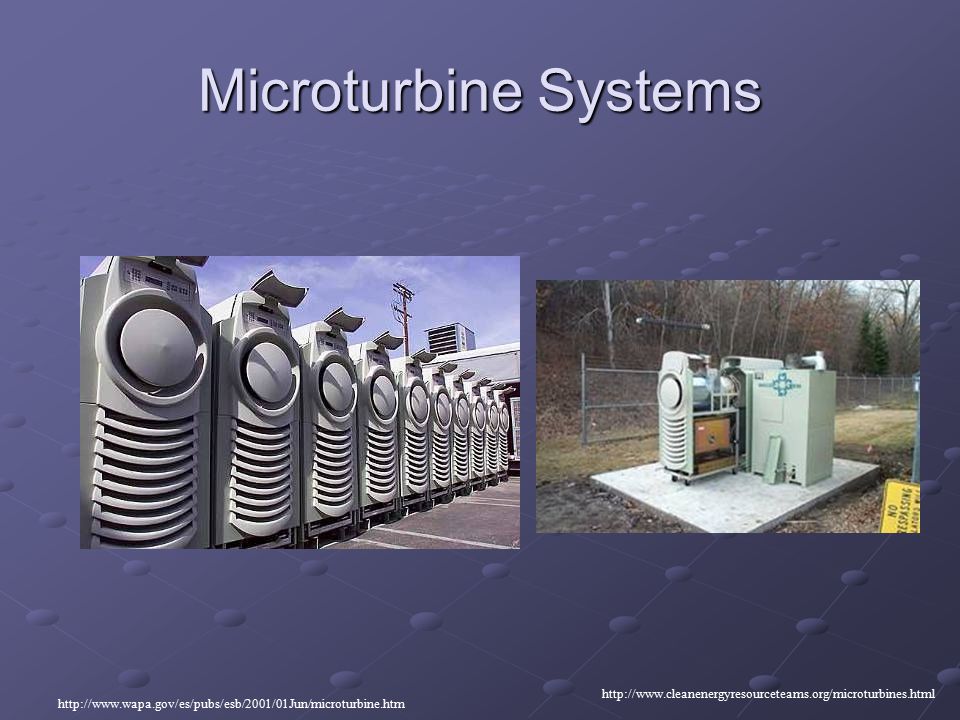
Microturbine Systems
42
Micro-Hydro These systems, which are designed to operate for a minimum of 20 years, are usually 'run-of-the-river' systems. This means they do not require a dam or storage facility to be constructed but simply divert water from the stream or river, channel it in to a valley and 'drop' it in to a turbine via a penstock (pipeline). This type of hydro generating thus avoids the damaging environmental and social effects that larger hydroelectric schemes cause. Cost for a typical micro-hydro system varies depending on the project. As a guide every kilowatt of power generated cost around £800. A 6-kilowatt system, enough to drive an electric mill and provide light for a community of about 500, would cost approximately £4,800. Experience shows that community capital (in labour and cash), financial credit and improved income makes these schemes economically viable and sustainable. Besides providing power for domestic lighting and cooking needs, village hydro schemes can also be used for charging batteries or for income generating activities like grain milling, depending on the needs of the community.
. This type of hydro generating thus avoids the damaging environmental and social effects that larger hydroelectric schemes cause. Cost for a typical micro-hydro system varies depending on the project. As a guide every kilowatt of power generated cost around £800. A 6-kilowatt system, enough to drive an electric mill and provide light for a community of about 500, would cost approximately £4,800. Experience shows that community capital (in labour and cash), financial credit and improved income makes these schemes economically viable and sustainable. Besides providing power for domestic lighting and cooking needs, village hydro schemes can also be used for charging batteries or for income generating activities like grain milling, depending on the needs of the community. id=micro_hydro_expertise.")
43
Summary Solutions Exist both on small scale and very large scale
We do not really have an energy crisis – we do have an energy by fossil fuel crisis Transition requires leadership and courage and commitment – a true test of humanity as a global entity. OTEC, Wind, Small Scale Solar, Snakes, Dragons, Hydrogen Production represents solution space

Similar presentations


 Energy Source: 100% Wind. Blue Sky Usage: $0.0078/kwh.>")


 increasing.>")


