Download presentation
Presentation is loading. Please wait.

1
The Changing Demographics of Missouri Seniors Developed by Dr. Daryl J. Hobbs & Bill Elder Presented by Dr. Bill Elder Interdisciplinary Geriatric Assessment Program April 20, 2005

2
Percent Change in Missouri Population by Selected Age Cohorts, 1990-2000 SOURCE: USDC, Bureau of the Census, Census of Population and Housing, Summary File 1 (2000); Summary Tape File 1 (1990) Produced by: The Office of Social and Economic Data Analysis, UOE [E.J. Cleveland, Nov. 2001]

4
American Community Survey 2002 Percent Population 65 years and Over United States2003200220012000 65 years and over 11.98%11.97%12.01% *12.06% * Male 42.43%42.29% *42.04% *41.98% * Female 57.57%57.71% *57.96% *58.02% * Missouri 2003200220012000 65 years and over 12.71%12.80%12.83% *12.91% * Male 42.45%42.05% *41.83% *41.57% * Female 57.55%57.95%58.17% *58.43% *

8
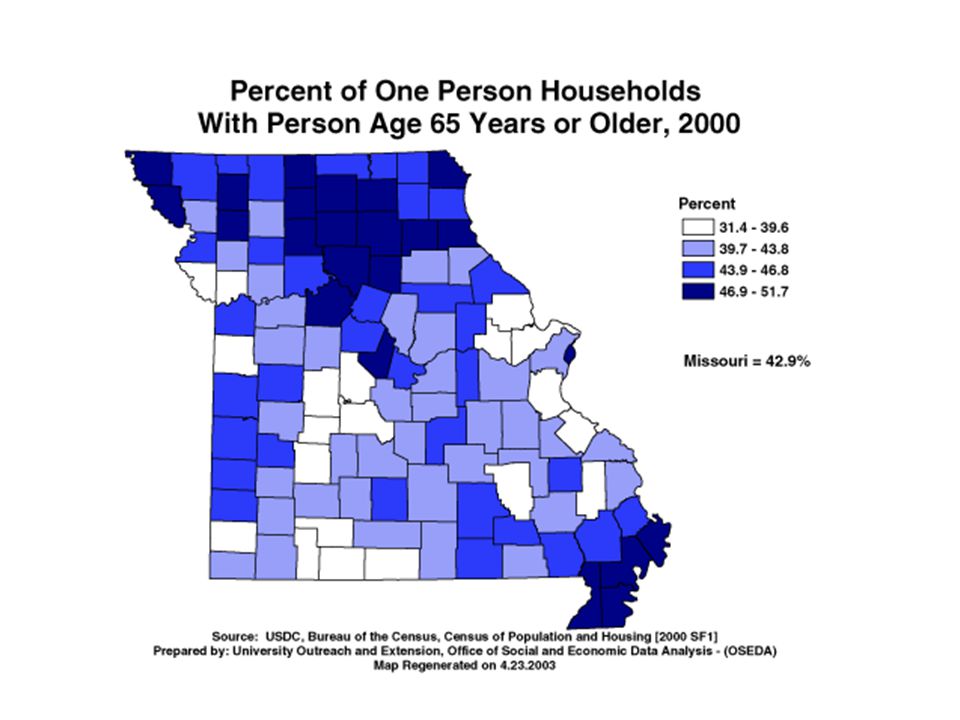
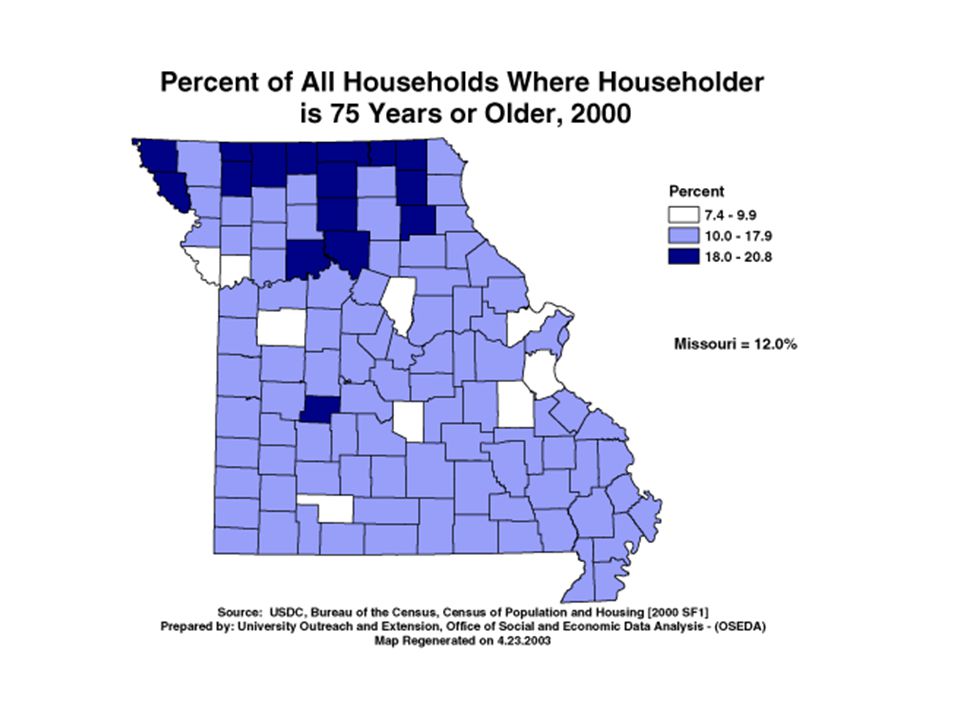
Senior Households

17
Sub-County Information for Program Planning

19
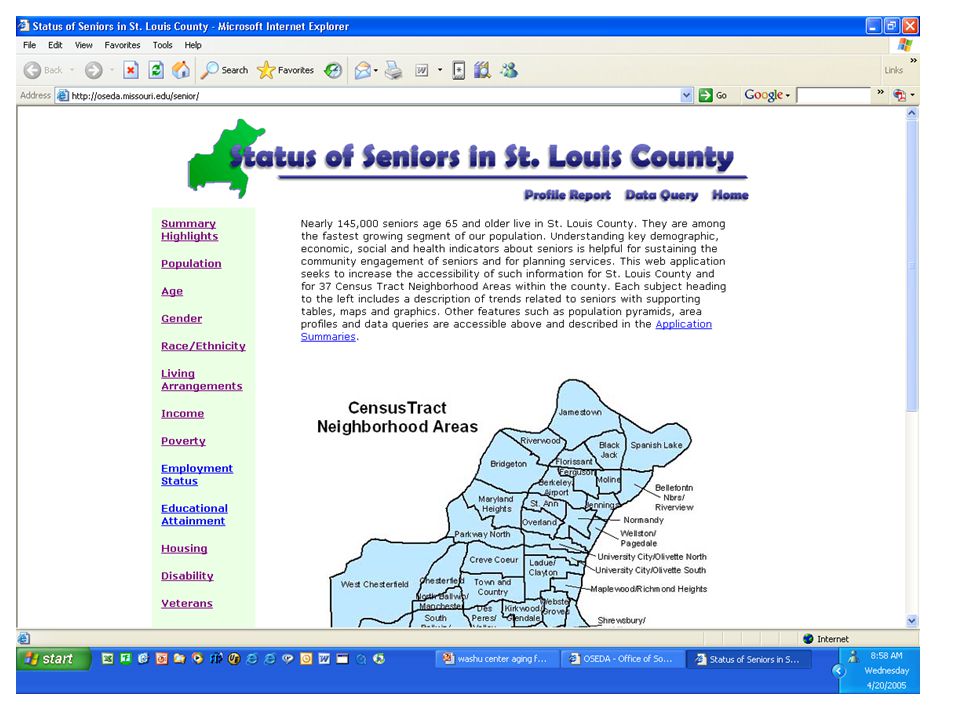
Summary ighlights Populatio n Age Gender Race/Eth nicity Living Arrange ments Income Poverty Employm ent Status Educatio nal Attainme nt Housing Disability Veterans Home Nearly 145,000 seniors age 65 and older live in St. Louis Conty. They are among the fastest growing segment of our population. Understanding key demographic, economic, social and health indicators about seniors is helpful for sustaining the community enggement of seniors and for planning services. This web application seeks to increase the accessibility of such information for St. Louis County and for 37 Census Tract Neighborhood Areas within the county. Each subject heading to the left includes a description of trends related to seniors with supporting tables, maps and graphics. Other features such as population pyramids, area profiles and data queries are accessible above and described in the Application Summaries.Application Summaries

21
Source: 2000 Census, Summary File 1, Table 12

22
Source: 2000 Census, Summary File 1, Table 12 Source: 2000 Census, Summary File 1, Table 12

31
The senior population in St. Louis County is about 90 percent White and 9 percent African American. The Hispanic population, which is not considered a racial category by the Census, accounts for 5 percent of the 2000 senior population.

33
Hispanic Population

34
Missouri's Hispanic Population by Age Cohorts 1990-2000 SOURCE: USDC, Bureau of the Census, Census of Population and Housing [2000 SF1; 1990 STF1] Prepared by: University Outreach and Extension, Office of Social and Economic Data Analysis – (OSEDA) Chart Generated on 3.5.2002
![Missouri s Hispanic Population by Age Cohorts SOURCE: USDC, Bureau of the Census, Census of Population and Housing [2000 SF1; 1990 STF1] Prepared by: University Outreach and Extension, Office of Social and Economic Data Analysis – (OSEDA) Chart Generated on](http://images.slideplayer.com/16/5003411/slides/slide_34.jpg "Missouri s Hispanic Population by Age Cohorts SOURCE: USDC, Bureau of the Census, Census of Population and Housing [2000 SF1; 1990 STF1] Prepared by: University Outreach and Extension, Office of Social and Economic Data Analysis – (OSEDA) Chart Generated on")
35
Senior Employment

38
More than 20,000 (14.3 percent) St. Louis County seniors are employed, which is a slightly rate of senior employment than Missouri statewide (13.2 percent).
..")
40
Disabilities

44
Senior Poverty

45
Poverty Among Missouri Seniors Number of Missouri seniors with income below poverty declined from 99,306 in 1990 to 70,476 in 2000 – a 29 percent decrease The lowest senior poverty rates were in the St. Louis, Kansas City and Springfield metro areas and a 9 county area in central Missouri There were 30 counties in which more than 15 percent of seniors were below poverty with the majority concentrated in eastern Ozarks and Bootheel.

48
Senior Education

53
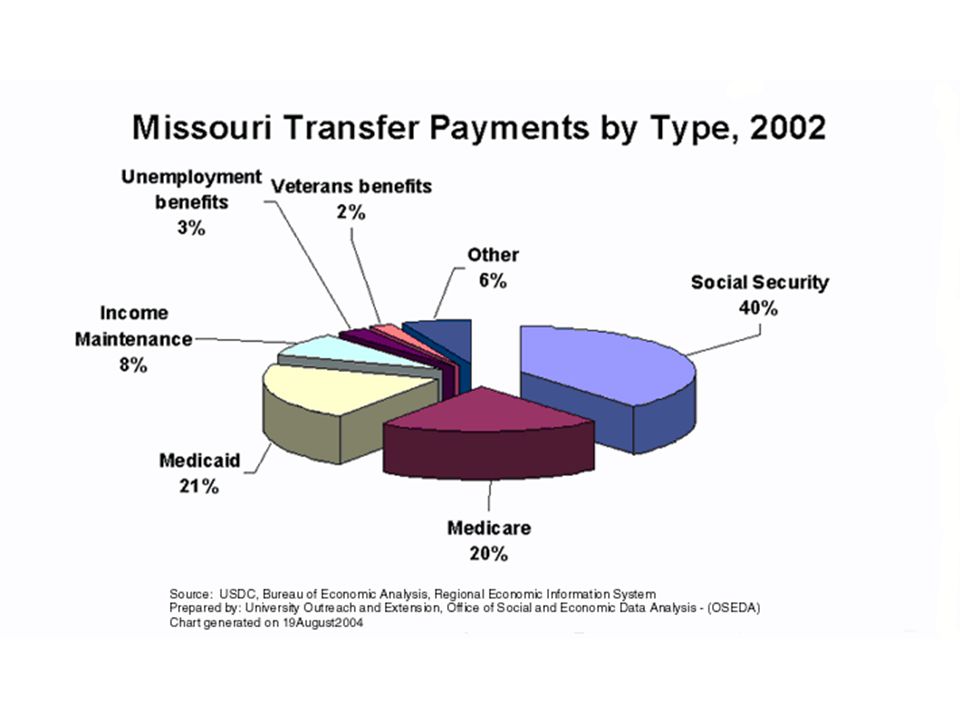
Impact and Change of Transfer Payments

57
The Missouri Senior Report: Concept Paper Need for community level analysis of aging issues The Missouri Seniors Report will enhance the well being of seniors by annually informing key audiences about both the contributions and the needs of Missouri seniors The report will explain the demographic, economic, health and social trends associated with the forthcoming expansion of the Missouri senior population. By 2025, the Missouri senior population is projected to increase to over 1.2 million—nearly 1 in 5 Missourians.

58
Focus on Civic Engagement Community groups will be involved in the design of the report through a series of town meetings Regional and community meetings where the findings will be presented, implications explored and local resources mobilized to help adapt to new demographic realities.

59
More Seniors will be both an opportunity and a challenge Maturation of the baby boom, increasing longevity, and favorable migration trends will fuel growth Seniors will have increasing political influence, economic impact, and social significance. Increased need for health and community support services will increase. Seniors turning 65 over the next 20 years will have higher education levels and have experienced a different labor market than current seniors.

60
Development Partners Department of Health and Senior Services University Extension Office of Social & Economic Data Analysis Area Agencies on Aging Faculty from UMC and other Universities Inviting ideas and additional partners Proposal development & pilot testing

Similar presentations


 University of Missouri.>")

>")


