Download presentation
Presentation is loading. Please wait.

1
Detect and Simulate Vegetation, Surface Temperature, Rainfall and Aerosol Changes: From Global to Local Examples from EOS MODIS remote sensing Examples from EOS MODIS remote sensing. Project 1: Global Skin Temperature variation Project 2: Urbanization impactsProject 2: Urbanization impacts Project 3: Simulate urbanization in GCMProject 3: Simulate urbanization in GCM Menglin Jin Department of Meteorology, Univ. of Maryland, College Park

2
ASTER Launched December 18, 1999 MODIS CERES MISR MOPITT Terra NASA EOS

3
NASA, Terra & Aqua NASA, Terra & Aqua –launches 1999, 2002 –705 km polar orbits, descending (10:30 a.m.) & ascending (1:30 p.m.) Sensor Characteristics Sensor Characteristics –36 spectral bands ranging from 0.41 to 14.385 µm –cross-track scan mirror with 2330 km swath width –Spatial resolutions: 250 m (bands 1 - 2) 500 m (bands 3 - 7) 1000 m (bands 8 - 36) –2% reflectance calibration accuracy –onboard solar diffuser & solar diffuser stability monitor MODerate-resolution Imaging Spectroradiometer (MODIS)
 & ascending (1:30 p.m.) Sensor Characteristics Sensor Characteristics –36 spectral bands ranging from 0.41 to µm –cross-track scan mirror with 2330 km swath width –Spatial resolutions: 250 m (bands 1 - 2) 500 m (bands 3 - 7) 1000 m (bands ) –2% reflectance calibration accuracy –onboard solar diffuser & solar diffuser stability monitor MODerate-resolution Imaging Spectroradiometer (MODIS)")
4
Fine mode a (0.55 µm) 0.0 0.1 0.2 0.3 0.4 0.8 0.7 0.5 0.6 Terra/MODIS Aerosol Optical Thickness (Y. J. Kaufman, D. Tanré, D. A. Chu, L. A. Remer et al. – NASA GSFC, University of Lille) Level-3 Monthly September 2000
 Level-3 Monthly September")
5
May 4, 2001 1535 UTC Terra/MODIS Aerosol Optical Thickness Aerosol Optical Thickness 0.0 0.6 1.0 0.8 0.4 0.2 sunglint King et al. (2003)
.")
6
Terra/MODIS Cloud Optical Thickness (M. D. King, S. Platnick et al. – NASA GSFC) cc 1 10 70 Level-3 Monthly August 2001 King et al. (2003)
 cc Level-3 Monthly August 2001 King et al. (2003).")
7
0 Water 1 Evergreen Needleleaf Forest 2 Evergreen Broadleaf Forest 3 Deciduous Needleleaf Forest 4 Deciduous Broadleaf Forest 5 Mixed Forests 6 Closed Shrublands 7 Open Shrublands 8 Woody Savannas 9 Savannas 10 Grasslands 11 Permanent Wetlands 12 Croplands 13 Urban and Built-Up 14 Cropland/Natural Veg. Mosaic 15 Snow and Ice 16 Barren or Sparsely Vegetated 17 Tundra MODIS Land Cover Classification

8
Project1: Urbanization impact on globe and regional Climate Jin and Zhang 2003, submitted to JGR

9
A Development of Population Density Copied from web

10
A Development of Population Density 1800 Wielicki et al. (2002)
")
11
A Development of Population Density 1990 Wielicki et al. (2002)
")
12
A Development of Population Density 1998 Wielicki et al. (2002)
")
13
Urbanization impacts Urbanization is one extreme example of human-induced land cover/land use change. Studying urban climate answers how and how much human affects climate and how the nature responds Goal: to better simulate urban in land surface model Need to better understand urban from new observations Globally, urban population is expected to be 60% in 2030, compared to 47% in 2000 and 30% in 1950.

14
Urban heat Island Use skin temperature instead of 2m surface air temperature (Jin et al. 1997, Jin 1999 Jin and Dickinson 2000, 2002) Combine land cover, albedo, skin temperature to identify urban heat island New York
 Combine land cover, albedo, skin temperature to identify urban heat island New York.")
15
Urban heat Island –Urban Index

16
Urban heat Island –Global Zonal Average, night time

17
Urban regions modify Surface Albedo and Emissivity Albedo Emissivity Consequently, urban changes surface energy budget

18
Urban Regions Modify Air Conditions Aerosol Optical Depth MODIS

19
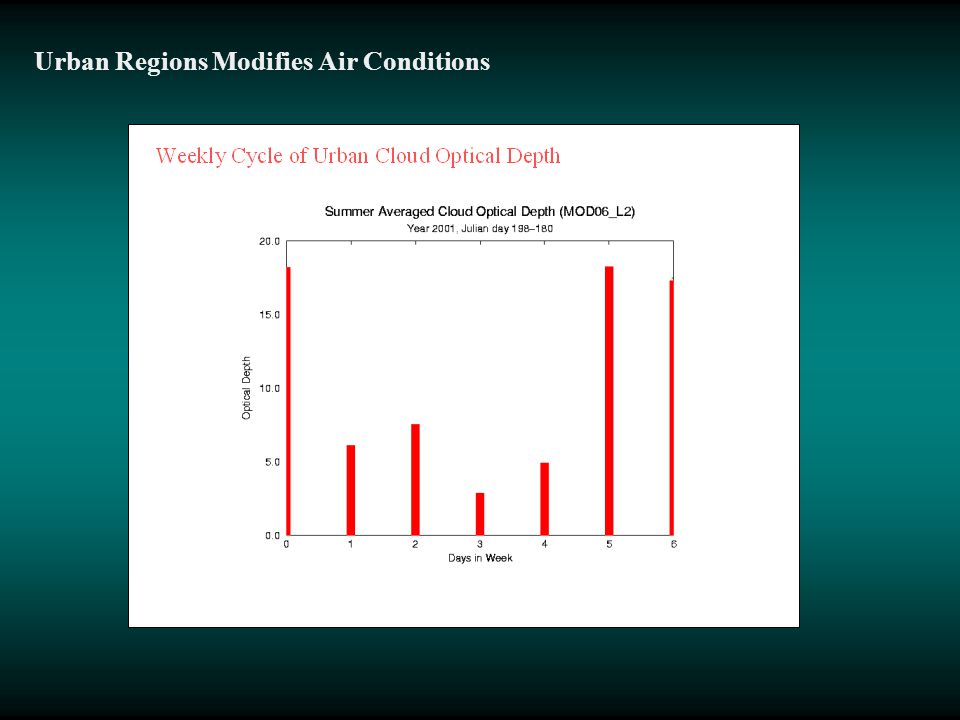
Urban Regions Modifies Air Conditions

24
Project1: Urbanization impact on globe and regional Climate Jin and Zhang 2003, submitted to JGR Urbanization Impact of Maryland

25
Maryland Population Change from 1980-1990

26
Historical Resident Population (1860-2000) Population Density People per square mile, 1990: 489.2 People per square mile, 2000: 541.9 Maryland Population, 1960-2000 19601970198019902000 Total3,100,6893,923,8974,216,9754,781,4685,296,486 Change823,208293,078564,493515,018 Percent Change26.5%7.5% 13.4%10.8%
 Population Density People per square mile, 1990: People per square mile, 2000: Maryland Population, Total3,100,6893,923,8974,216,9754,781,4685,296,486 Change823,208293,078564,493515,018 Percent Change26.5%7.5% 13.4%10.8%")
28
TRMM Rainfall Observations June 1998June 1999 June 2001 June 2002

29
Inter-annual monthly rainfall

30
Vegetation NDVI and LAI NDVI – Normalized Dimentionless Vegetation Index LAI – Leaf Area Index NDVI reflects Greenness of surface LAI reflects vegetation density, coverage

31
AVHRR observed NDVI difference

32
Maryland aerosol variations Aerosol optical depth for June 2000

33
Maryland aerosol variations Optical Depth for June 2001

34
Maryland aerosol variations MODIS optical depth for June 2002

35
Maryland aerosol variations

36
Project1: Urbanization impact on globe and regional Climate Jin and Zhang 2003, submitted to JGR Urbanization Impact of Maryland Project 2: Global Land Skin Temperature Changes

37
Global Mean Skin Temperature Variations Trend of global land surface Skin Temperature

38
Regional Change of Land Skin Temperature AVHRR

39
Regional Change of Land Skin Temperature

40
Project1: Urbanization impact on globe and regional Climate Jin and Zhang 2003, submitted to JGR Urbanization Impact of Maryland Project 2: Global Land Skin Temperature Changes Project 3: Simulate urbanization in land surface model

41
Modeling Urban Land-Atmosphere Interactions Principal Investigator:Dr. Christa D. Peters-Lidard/974 Co-Investigator: Dr. Menglin Jin, Assistant Research Scientist, Meteorology Dept, U. MD (Shepherd and Burian, 2002) (Jin and Dickinson, 2002) Enhanced Precipitation Near Houston, Texas Enhanced Sulfate Aerosol Near Houston, Texas Motivation: Globally, urban population is expected to be 60% in 2030, compared to 47% in 2000 and 30% in 1950. Dynamic nature of population shifts demands application of remotely-sensed urban parameters and detailed models, esp. for future mission requirements Develop GSFC capability to model observed effects of urban land-atmosphere interactions on precipitation, aerosols, temperatures
 (Jin and Dickinson, 2002) Enhanced Precipitation Near Houston, Texas Enhanced Sulfate Aerosol Near Houston, Texas Motivation: Globally, urban population is expected to be 60% in 2030, compared to 47% in 2000 and 30% in Dynamic nature of population shifts demands application of remotely-sensed urban parameters and detailed models, esp. for future mission requirements Develop GSFC capability to model observed effects of urban land-atmosphere interactions on precipitation, aerosols, temperatures.")
42
I.Estimate Urban Land Surface Properties from Satellite and Other Platforms Albedo, Emissivity, Heat Capacity Impervious Area, Building Height/Density, Roughness Lengths II.Develop and Evaluate Model of Urban Land Surface-Atmosphere Processes: Water, Energy, Mass, Momentum Incorporate Remotely Sensed Urban Land Surface Properties Couple existing land surface (CLM/NOAH) and 910 internal boundary layer models for application at landscape scales (1km; Land Information System) Apply and evaluate for Houston Texas 2000 Field Campaign Project Activities
 and 910 internal boundary layer models for application at landscape scales (1km; Land Information System) Apply and evaluate for Houston Texas 2000 Field Campaign Project Activities")
Similar presentations


 Kirsten de Beurs.>")


 and Landsat Thematic Mapper (TM) Sensor System Characteristics.>")


 Menglin Jin, San Jose Stte University Outline Physical principles International satellite.>")


