Download presentation
Presentation is loading. Please wait.

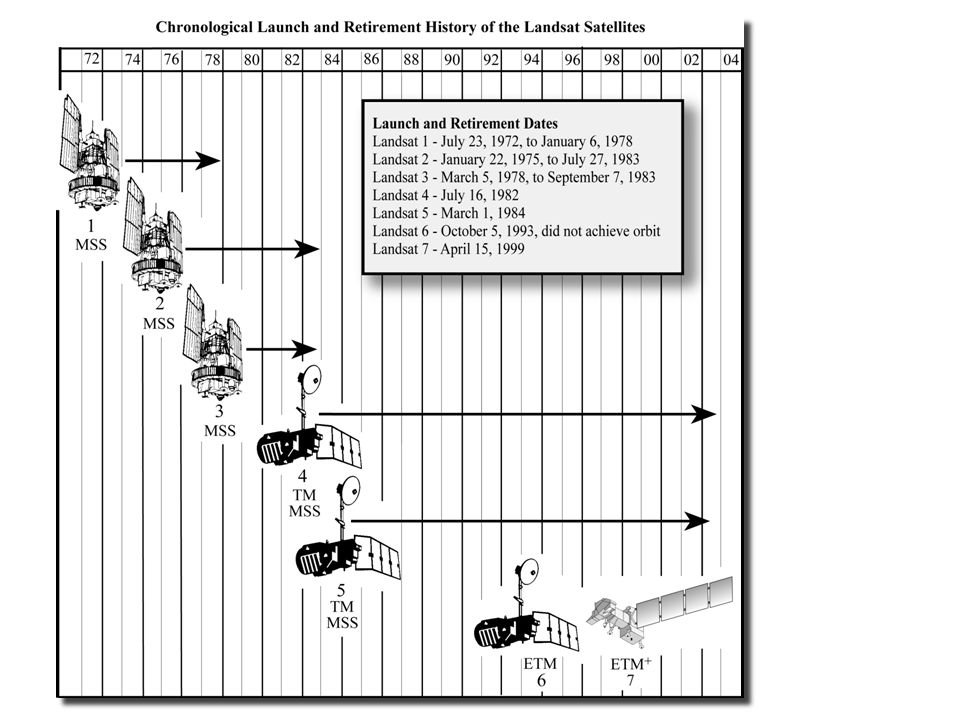
1
Some Significant Current Projects

3
Landsat Multispectral Scanner (MSS) and Landsat Thematic Mapper (TM) Sensor System Characteristics
 and Landsat Thematic Mapper (TM) Sensor System Characteristics")
4
Components of the Landsat 4 and 5 Thematic Mapper

6
Reflectance of the Upper Surface of A Sycamore Leaf at Different Moisture Contents

7
GOES

8
GOES East and West Coverage GOES East and West Coverage

9
GOES East and West Coverage GOES East Infrared GOES East Infrared August 25, 1989 GOES East Infrared GOES East Infrared August 25, 1989

10
AVHRR

12
Advanced Very High Resolution Radiometer (AVHRR) Bandwidths
 Bandwidths")
13
Advanced Very High Resolution Radiometer (AVHRR) Imagery
 Imagery")
14
Advanced Very High Resolution Radiometer (AVHRR) Mosaic of the Conterminous United States
 Mosaic of the Conterminous United States")
15
What is NDVI? The Normalized Difference Vegetation Index (NDVI) has been in use for many years to measure and monitor plant growth (vigor), vegetation cover, and biomass production from multispectral satellite data. The NDVI image maps shown here are prepared from 1-km AVHRR spectral data in the visible (Channel 1; 0.58- 0.68 micrometers) and near infrared (Channel 2; 0.725- 1.10 micrometers) regions of the electromagnetic spectrum. NDVI is calculated as follows: NDVI = (Channel 2 - Channel 1) / (Channel 2 + Channel 1)
 has been in use for many years to measure and monitor plant growth (vigor), vegetation cover, and biomass production from multispectral satellite data. The NDVI image maps shown here are prepared from 1-km AVHRR spectral data in the visible (Channel 1; micrometers) and near infrared (Channel 2; micrometers) regions of the electromagnetic spectrum. NDVI is calculated as follows: NDVI = (Channel 2 - Channel 1) / (Channel 2 + Channel 1).")
16
The principle behind NDVI is that Channel 1 is in the red-light region of the electromagnetic spectrum where chlorophyll causes considerable absorption of incoming sunlight, whereas Channel 2 is in the near- infrared region of the spectrum where a plant's spongy mesophyll leaf structure creates considerable reflectance (Tucker 1979, Jackson et al.1983, Tucker et al. 1991). As a result, vigorously growing healthy vegetation has low red-light reflectance and high near-infrared reflectance, and hence, high NDVI values. This relatively simply algorithm produces output values in the range of -1.0 to 1.0. Increasing positive NDVI values, shown in increasing shades of green on the images, indicate increasing amounts of green vegetation. NDVI values near zero and decreasing negative values indicate non-vegetated features such as barren surfaces (rock and soil) and water, snow, ice, and clouds.Tucker 1979Jackson et al.1983Tucker et al. 1991
. As a result, vigorously growing healthy vegetation has low red-light reflectance and high near-infrared reflectance, and hence, high NDVI values. This relatively simply algorithm produces output values in the range of -1.0 to 1.0. Increasing positive NDVI values, shown in increasing shades of green on the images, indicate increasing amounts of green vegetation. NDVI values near zero and decreasing negative values indicate non-vegetated features such as barren surfaces (rock and soil) and water, snow, ice, and clouds.Tucker 1979Jackson et al.1983Tucker et al")
20
Advanced Spaceborne Thermal Emission and Reflection Radiometer (ASTER) Onboard Terra Advanced Spaceborne Thermal Emission and Reflection Radiometer (ASTER) Onboard Terra Oahu, HI 15 x 15 m (RGB = 1,4,3) Oahu, HI 15 x 15 m (RGB = 1,4,3)
 Onboard Terra Advanced Spaceborne Thermal Emission and Reflection Radiometer (ASTER) Onboard Terra Oahu, HI 15 x 15 m (RGB = 1,4,3) Oahu, HI 15 x 15 m (RGB = 1,4,3)")
21
Advanced Spaceborne Thermal Emission and Reflection Radiometer (ASTER) Onboard Terra Advanced Spaceborne Thermal Emission and Reflection Radiometer (ASTER) Onboard Terra North Shore Oahu, HI 15 x 15 m (RGB= 1,4,3) North Shore Oahu, HI 15 x 15 m (RGB= 1,4,3)
 Onboard Terra Advanced Spaceborne Thermal Emission and Reflection Radiometer (ASTER) Onboard Terra North Shore Oahu, HI 15 x 15 m (RGB= 1,4,3) North Shore Oahu, HI 15 x 15 m (RGB= 1,4,3)")
22
Advanced Spaceborne Thermal Emission and Reflection Radiometer (ASTER) Onboard Terra Advanced Spaceborne Thermal Emission and Reflection Radiometer (ASTER) Onboard Terra Pearl Harbor, Hawaii, 15 x 15 m (RGB= 1,4,3)
 Onboard Terra Advanced Spaceborne Thermal Emission and Reflection Radiometer (ASTER) Onboard Terra Pearl Harbor, Hawaii, 15 x 15 m (RGB= 1,4,3)")
24
Earth Observing System - Terra Instruments ASTER - Advanced Spaceborne Thermal Emission and Reflection Radiometer CERES - Clouds and the Earth’s Radiant Energy System MISR - Multi-angle Imaging Spectroradiometer MODIS - Moderate-resolution Imaging Spectroradiometer MOPITT - Measurement of Pollution in the Troposphere ASTER - Advanced Spaceborne Thermal Emission and Reflection Radiometer CERES - Clouds and the Earth’s Radiant Energy System MISR - Multi-angle Imaging Spectroradiometer MODIS - Moderate-resolution Imaging Spectroradiometer MOPITT - Measurement of Pollution in the Troposphere

25
DisciplineDiscipline EOS-AM Instruments MeasurementMeasurement AtmosphereCloud Properties MODIS, MISR, ASTER Radiative Energy FluxesCERES, MODIS, MISR Precipitation Tropospheric ChemistryMOPITT Stratospheric Chemistry Aerosol PropertiesMISR, MODIS Atmospheric TemperatureMODIS Atmospheric HumidityMODIS Lightning AtmosphereCloud Properties MODIS, MISR, ASTER Radiative Energy FluxesCERES, MODIS, MISR Precipitation Tropospheric ChemistryMOPITT Stratospheric Chemistry Aerosol PropertiesMISR, MODIS Atmospheric TemperatureMODIS Atmospheric HumidityMODIS Lightning Earth Observing System Measurements

26
DisciplineDiscipline EOS-AM Instruments MeasurementMeasurement LandLand Cover/Land Use ChangeMODIS, MISR, ASTER Vegetation DynamicsMODIS, MISR, ASTER Surface TemperatureMODIS, ASTER Fire OccurrenceMODIS, ASTER Volcanic EffectsMODIS, MISR, ASTER Surface Wetness LandLand Cover/Land Use ChangeMODIS, MISR, ASTER Vegetation DynamicsMODIS, MISR, ASTER Surface TemperatureMODIS, ASTER Fire OccurrenceMODIS, ASTER Volcanic EffectsMODIS, MISR, ASTER Surface Wetness Earth Observing System Measurements

27
DisciplineDiscipline EOS-AM Instruments MeasurementMeasurement OceanSurface TemperatureMODIS Phytoplankton MODIS, MISR Dissolved Organic MatterMODIS, MISR Surface Wind Fields Ocean Surface Topography OceanSurface TemperatureMODIS Phytoplankton MODIS, MISR Dissolved Organic MatterMODIS, MISR Surface Wind Fields Ocean Surface Topography CryosphereLand Ice ChangeASTER Sea Ice MODIS, ASTER Snow CoverMODIS, ASTER CryosphereLand Ice ChangeASTER Sea Ice MODIS, ASTER Snow CoverMODIS, ASTER Solar RadiationTotal Solar Radiation Ultraviolet Spectral Irradiance Solar RadiationTotal Solar Radiation Ultraviolet Spectral Irradiance Earth Observing System Measurements

28
Earth Observing System - Terra Instruments MODIS - Moderate-resolution Imaging Spectroradiometer Spectral Range 0.4 - 14.4 m Spectral Coverage +55˚, 2330 km swath Spatial Resolution 250 m (2 bands), 500 m (5 bands), 1000 m (29 bands) MODIS - Moderate-resolution Imaging Spectroradiometer Spectral Range 0.4 - 14.4 m Spectral Coverage +55˚, 2330 km swath Spatial Resolution 250 m (2 bands), 500 m (5 bands), 1000 m (29 bands) ASTER - Advanced Spaceborne Thermal Emission and Reflection Radiometer Spectral Range VNIR 0.4 - 14.4 m, SWIR 1.6 - 2.5 m, TIR 8 - 12 m Spatial Resolution 15 m (VNIR : 3 bands) 30 m (SWIR: 6 bands) 30 m (SWIR: 6 bands) 90 m (TIR: 5 bands) 90 m (TIR: 5 bands) ASTER - Advanced Spaceborne Thermal Emission and Reflection Radiometer Spectral Range VNIR 0.4 - 14.4 m, SWIR 1.6 - 2.5 m, TIR 8 - 12 m Spatial Resolution 15 m (VNIR : 3 bands) 30 m (SWIR: 6 bands) 30 m (SWIR: 6 bands) 90 m (TIR: 5 bands) 90 m (TIR: 5 bands)
, 500 m (5 bands), 1000 m (29 bands) MODIS - Moderate-resolution Imaging Spectroradiometer Spectral Range m Spectral Coverage +55˚, 2330 km swath Spatial Resolution 250 m (2 bands), 500 m (5 bands), 1000 m (29 bands) ASTER - Advanced Spaceborne Thermal Emission and Reflection Radiometer Spectral Range VNIR m, SWIR m, TIR m Spatial Resolution 15 m (VNIR : 3 bands) 30 m (SWIR: 6 bands) 30 m (SWIR: 6 bands) 90 m (TIR: 5 bands) 90 m (TIR: 5 bands) ASTER - Advanced Spaceborne Thermal Emission and Reflection Radiometer Spectral Range VNIR m, SWIR m, TIR m Spatial Resolution 15 m (VNIR : 3 bands) 30 m (SWIR: 6 bands) 30 m (SWIR: 6 bands) 90 m (TIR: 5 bands) 90 m (TIR: 5 bands)")
29
MODIS

Similar presentations


 M. Fujita, T. Tachikawa, M. Kato, H. Tsu ( ERSDAC, Japan), M.J. Abrams, L. Maldonado.>")

>")


-Polar Orbiting Environmental Satellite (POES) Orbital characteristics.>")


