Download presentation
Presentation is loading. Please wait.

1
Team Flow Eric Parker Jason Gunn Nathan Funk

2
Outline zBackground zPrevious Work zModeling zResults and Conclusions zQuestions

3
FLOW SYSTEM Flow Background Storage Tank Pump Flow Meter

4
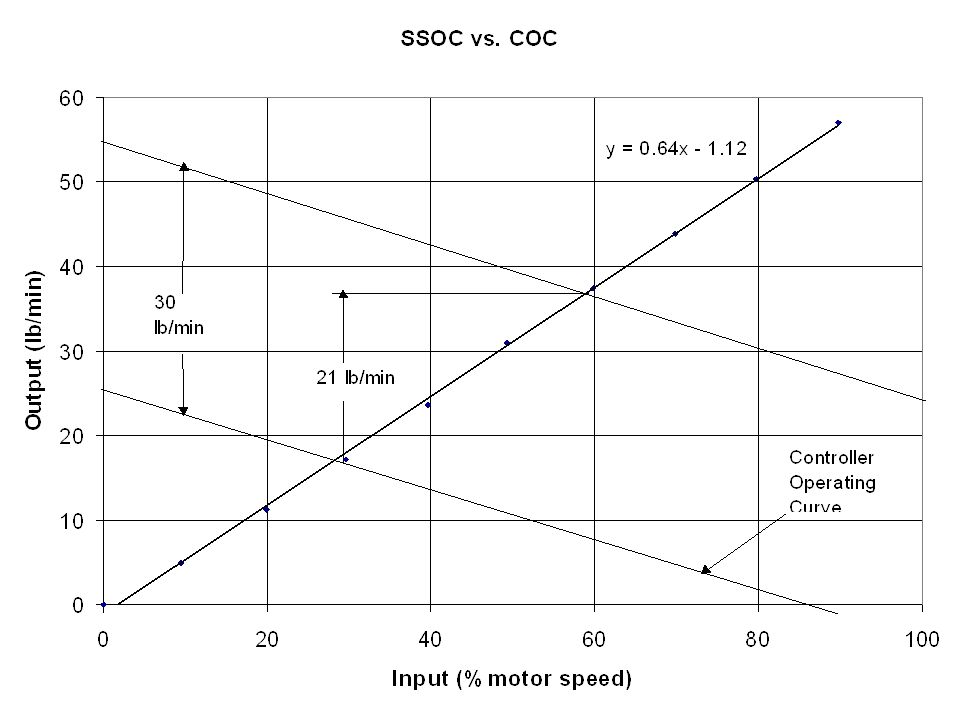
Flow Background zInput = % motor speed zOutput = mass flow rate (lbs/min) zSSOC yOperating Range 10% - 90%
 zSSOC yOperating Range 10% - 90%")
6
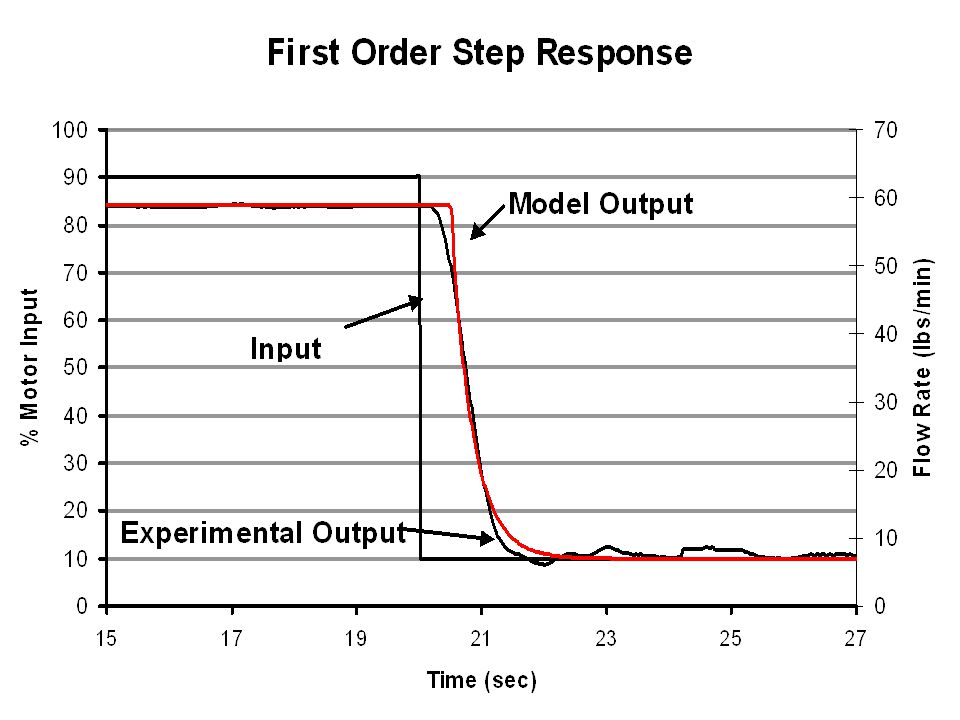
Previous Work zModeling Step Input zFOPDT Model zTransfer Function Parameters ytau=0.4secK=0.66 (lbs/min)/% yto=0.3sec where G=(Ke^(to*s))/(tau*s+1)
/% yto=0.3sec where G=(Ke^(to*s))/(tau*s+1)")
8
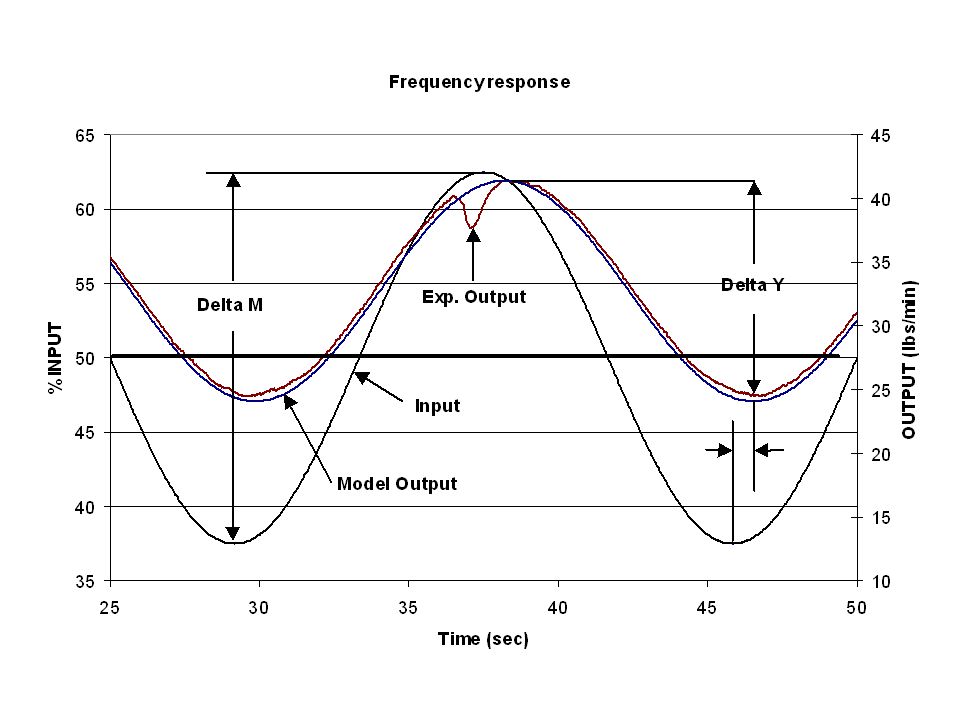
Previous Work zModeling Sine Input zFOPDT Model zTransfer Function Parameters ytau=0.4secK=0.7 (lbs/min)/% yto=0.3sec zBode Plots
/% yto=0.3sec zBode Plots")
10
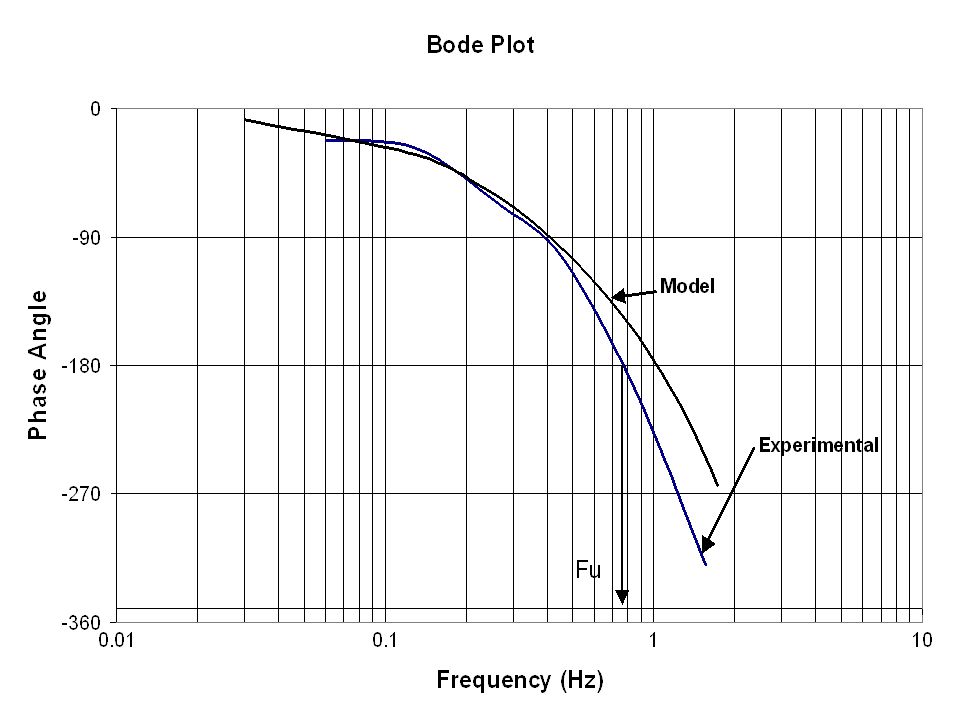
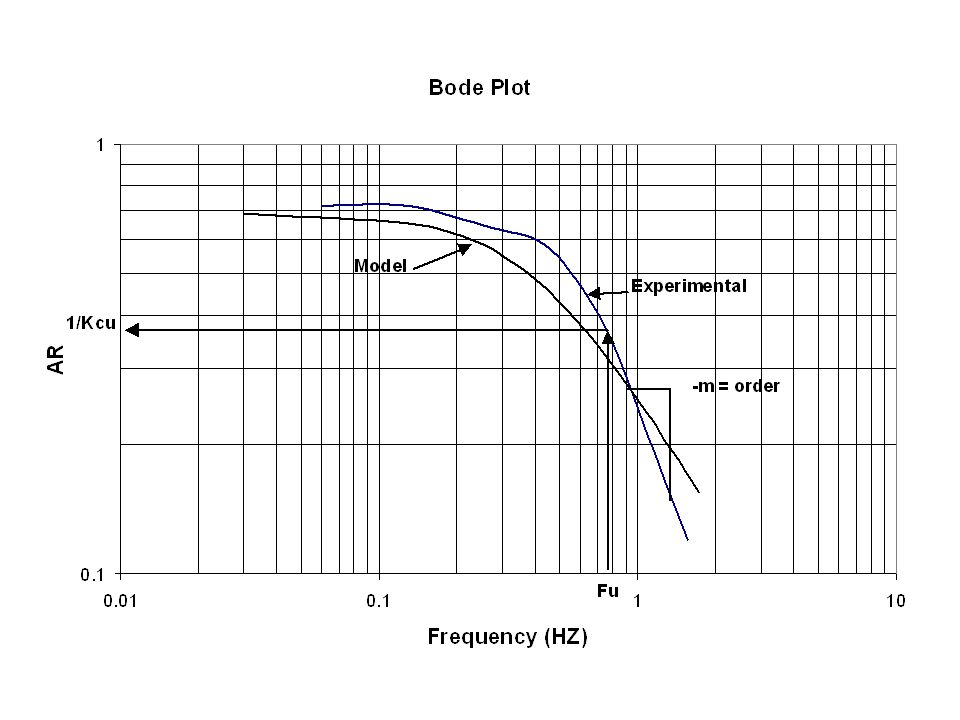
Bode Plots zTwo Types zPhase Angle vs Frequency zAR vs Frequency

13
Bode Results zApparent Order is 1.8 zKcu = 2.6 (lbs/min)/% zFu = 0.8 Hz
/% zFu = 0.8 Hz")
14
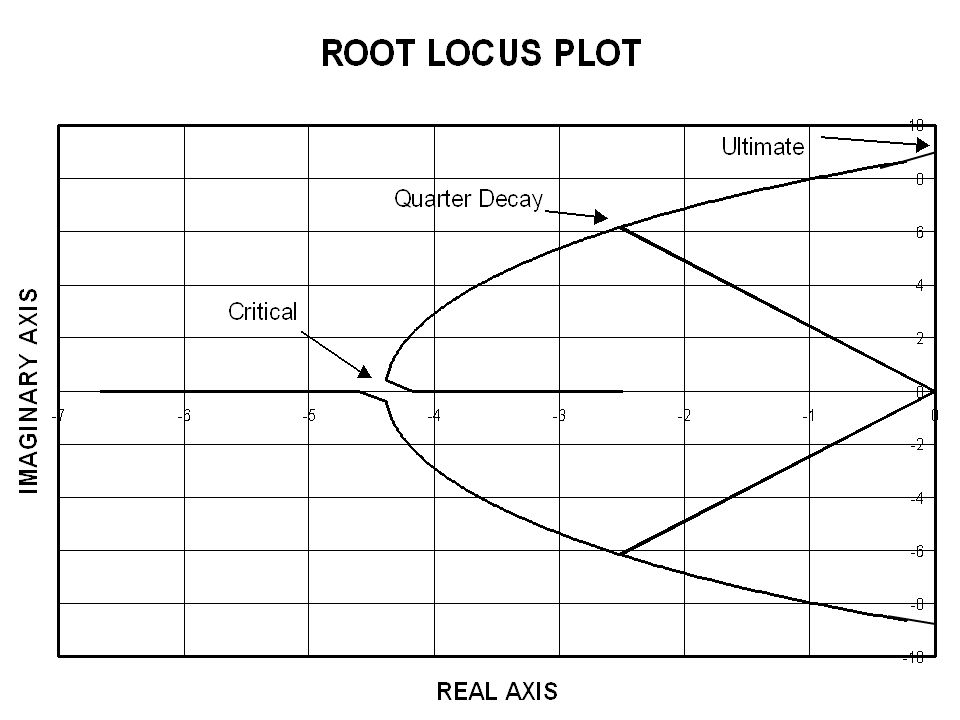
Modeling zRoot Locus

16
Theoretical Results zK cd =.22 zK qd =3.4 zK cu =5.2

17
Experimental Results zK cd =<.1 zK qd =1.6 zK cu =2.3

19
4.0 1

20
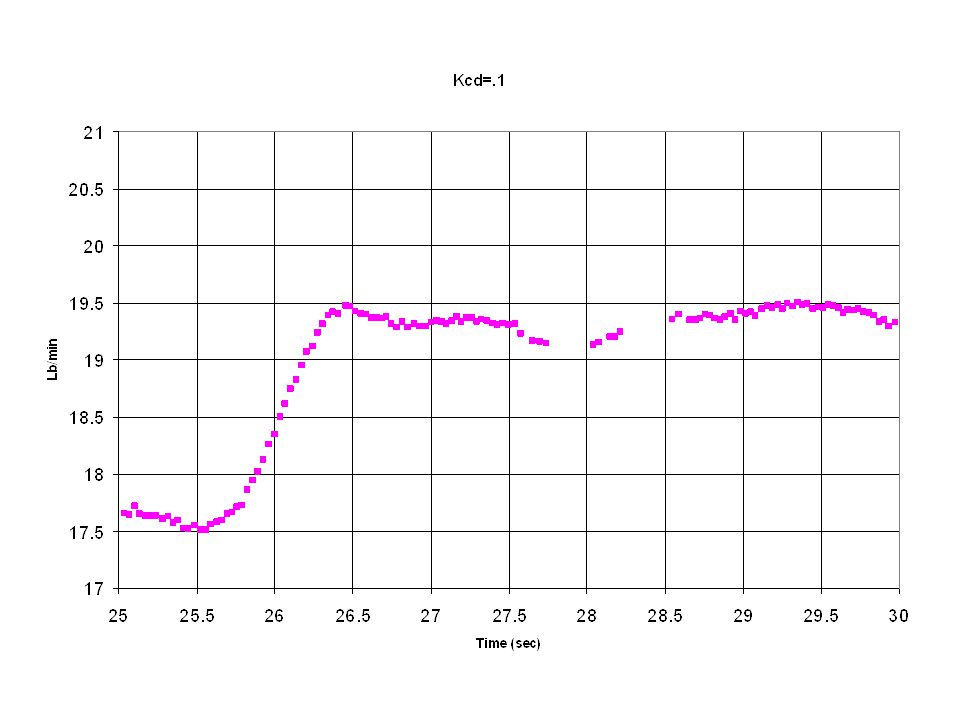
Verification z1st peak = 4.0 z2nd peak = 1.0 z1/4 =.25 decay z Frequency z 1/(31.7-30.5)=.83hz
=.83hz")
21
53.5

22
Calculations z1st peak=37.5 - 32.5=5 z2nd peak=36-32.5=35 zDecay=(3.5/5)=.70 z Frequency z 1/(59.2-57.9) =.77hz
=.70 z Frequency z 1/( ) =.77hz")
23
Experimental Results zK cd =<.1 zK qd =1.6 zK cu =2.3

24
Discussion Theory Experimental K cd =.22 K cd <.1 K qd =3.4 K qd =1.6 K cu =5.2 K cu =2.3

25
Conclusions zCritical damped K c value.1 zQuarter decay K c value 1.6 zUltimate Kc value 2.3

26
Q UESTIONS ?

Similar presentations


>")

 simply add which.>")
 Controllers Team Purple: John Pangle Jessica Raymond Justin Whitt ENGR 329 November 30, 2005.>")


