Download presentation
Presentation is loading. Please wait.

1
Red Team Amanda Newman Ankit Patel Bryan Cuervo UTC ENGR 329 Sept. 14, 2005

2
Outline Process Control Theory Background Steady State/Step Response Results Conclusions

3
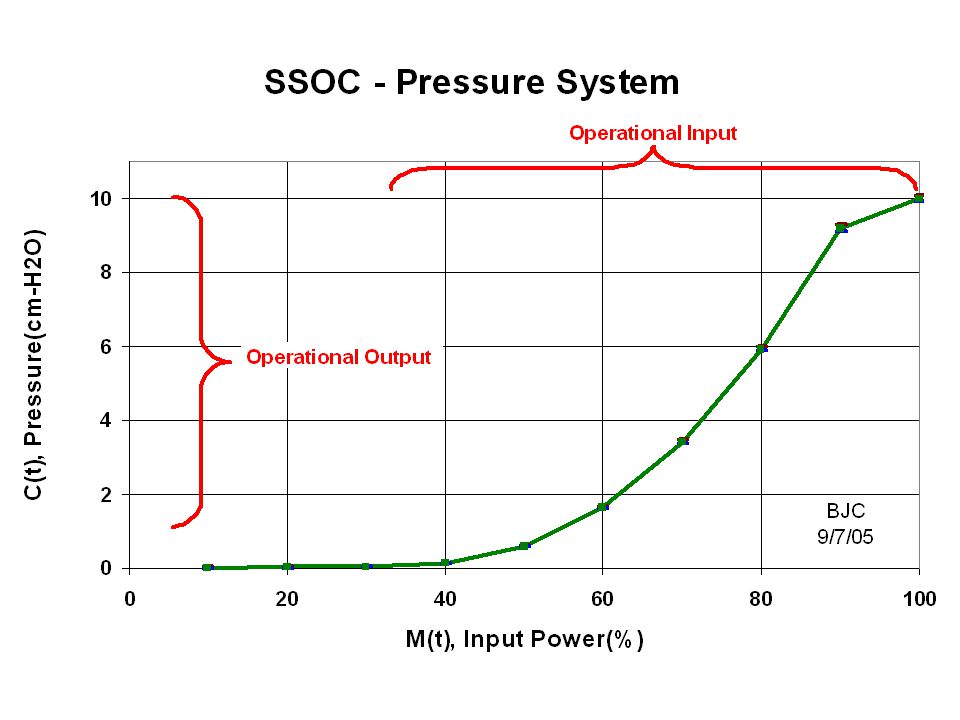
Systems Identification M(t) vs. C(t) The SSOC Operation range The FOPDT Steady-state gain, response time, dead time
 The SSOC Operation range The FOPDT Steady-state gain, response time, dead time.")
4
Background – System Parameters Input M(t) % power to blower motor (%) Output C(t) Pressure (cm-H2O)
 % power to blower motor (%) Output C(t) Pressure (cm-H2O)")
5
Block Diagram – Pressure System

6
Pressure System Schematic

7
TAPTUBING OUTLET BLOWER MOTOR VARIABLE SPEED DRIVE CIRCUIT CONNECTOR PRESSURE RECORDING CONTROLLER DAMPERS TRANS- DUCER

8
SSOC Calculations Steady-state response curves Trials at 10% input intervals Sample range taken from steady-state region (12-15 seconds)
")
9
Results – Pressure System

11
FOPDT PARAMETER CALCULATIONS Input ranges 10-40%, 40-70%, 70-100% All “UP” Steps 4 trials per input step range t 0,T and K Ave 95% confidence level – Student’s t

12
Results – Step Response

14
Parameter Results – Data Sample

15
Parameter Results

18
Summary and Conclusions The C(t), M(t) relation SSOC Non-linear 1-10 cm-H2O Operational output range 30%-100% Operational input range
, M(t) relation SSOC Non-linear 1-10 cm-H2O Operational output range 30%-100% Operational input range")
19
Summary and Conclusions FOPDT Step Response Parameters Gain – Increases from lower to upper ranges. Response Time – Significant variance between ranges. Dead Time – Decreases from lower to upper ranges.

Similar presentations


 into c(t): Negative Feedback Control with Proportional Only Controller Jigsaw Team Estrogen Stephanie Wilson Amanda Newman Jessica Raymond.>")

 Controllers Team Purple: John Pangle Jessica Raymond Justin Whitt ENGR 329 November 30, 2005.>")


