Download presentation
Presentation is loading. Please wait.

1
90 60 30 0 40 80120 0 160 Mean annual temperature (°F) Mean annual precipitation (inches)
 Mean annual precipitation (inches)")
3
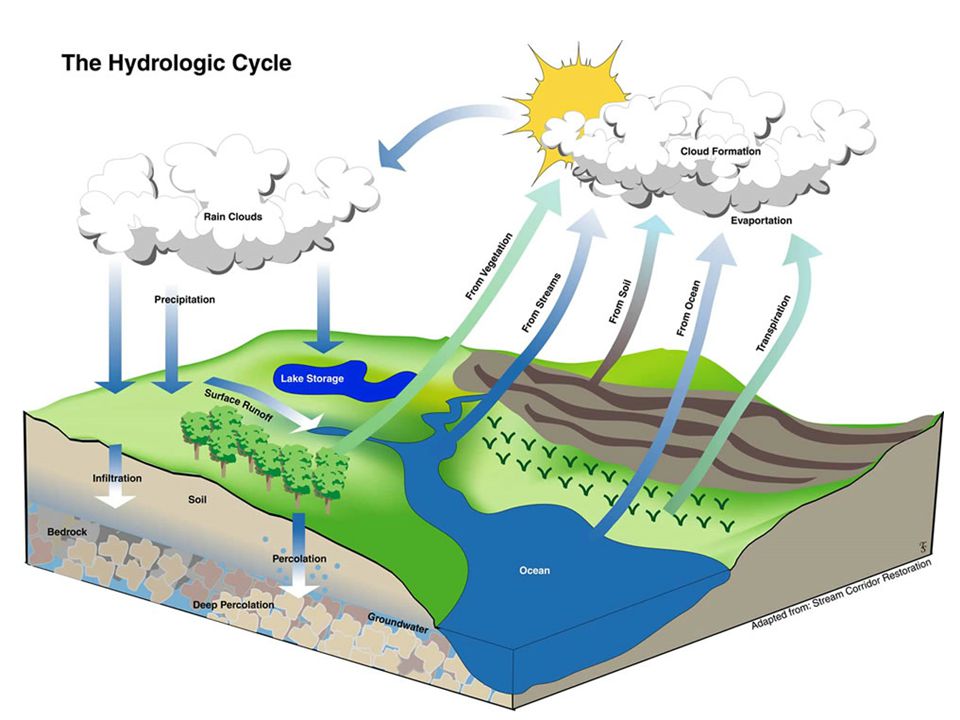
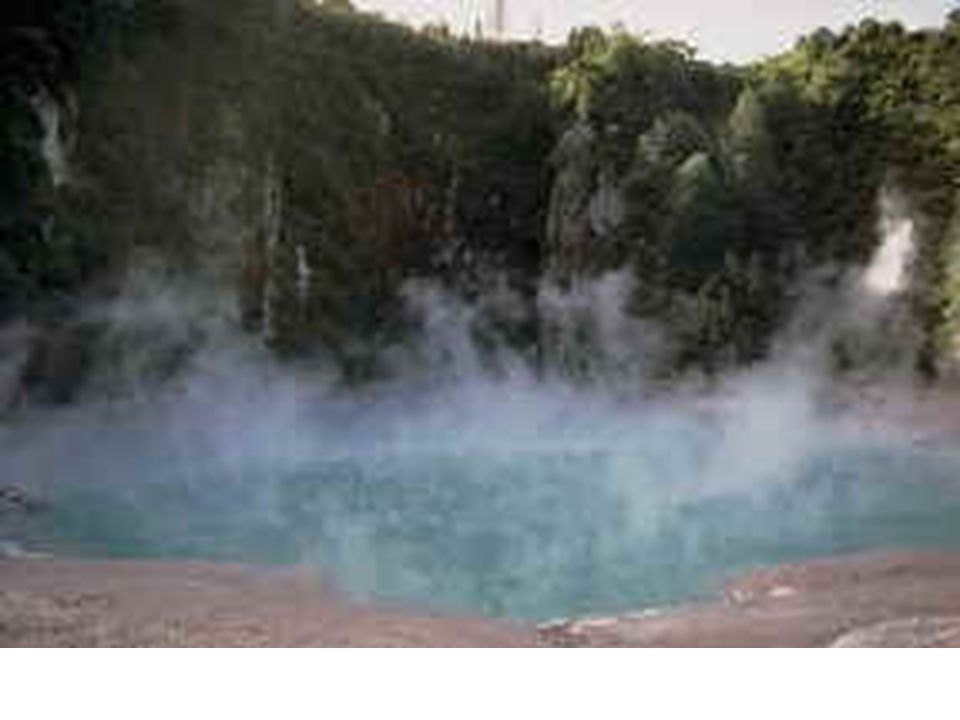
To change phase, H2O molecules need energy to break bonds and escape from the liquid Evaporation

4
Hotter means more water vapor in atmosphere

6
evaporation rates dependent not only on temperature but also wind speed

9
Condensation

10
Most condensation falls as rain

11
Clouds need cloud condensation nuclei (CCNs)
")
12
Nucleation Automobiles Industry Biomass burning cloud Precursor gases: Rainout Evaporation Growth Dry deposition (sulfur dioxide, nitrogen oxides) Cloud uptake Aerosol Cycles [adapted from Jakob, 1999]
![Nucleation Automobiles Industry Biomass burning cloud Precursor gases: Rainout Evaporation Growth Dry deposition (sulfur dioxide, nitrogen oxides) Cloud uptake Aerosol Cycles [adapted from Jakob, 1999]](http://images.slideplayer.com/16/5042806/slides/slide_12.jpg "Nucleation Automobiles Industry Biomass burning cloud Precursor gases: Rainout Evaporation Growth Dry deposition (sulfur dioxide, nitrogen oxides) Cloud uptake Aerosol Cycles [adapted from Jakob, 1999]")
13
Aerosols and Climate: Direct Effect Direct Effect: Scattering and absorption by particles photo: SeaWifs website

14
[Durkee et al., 2000] Aerosol indirect effect
![[Durkee et al., 2000] Aerosol indirect effect](http://images.slideplayer.com/16/5042806/slides/slide_14.jpg "[Durkee et al., 2000] Aerosol indirect effect")
15
Aerosol Indirect Effect Anthropogenic aerosol example using ship emissions: (Johnson et al., 1996)
")
16
Cloud Formation in a Clean and Polluted Atmosphere

17
This cloud has only few cloud droplets, hence, reflects less sunlight (darker cloud). This cloud has more cloud droplets, hence, reflects more sunlight (lighter cloud).
..")
18
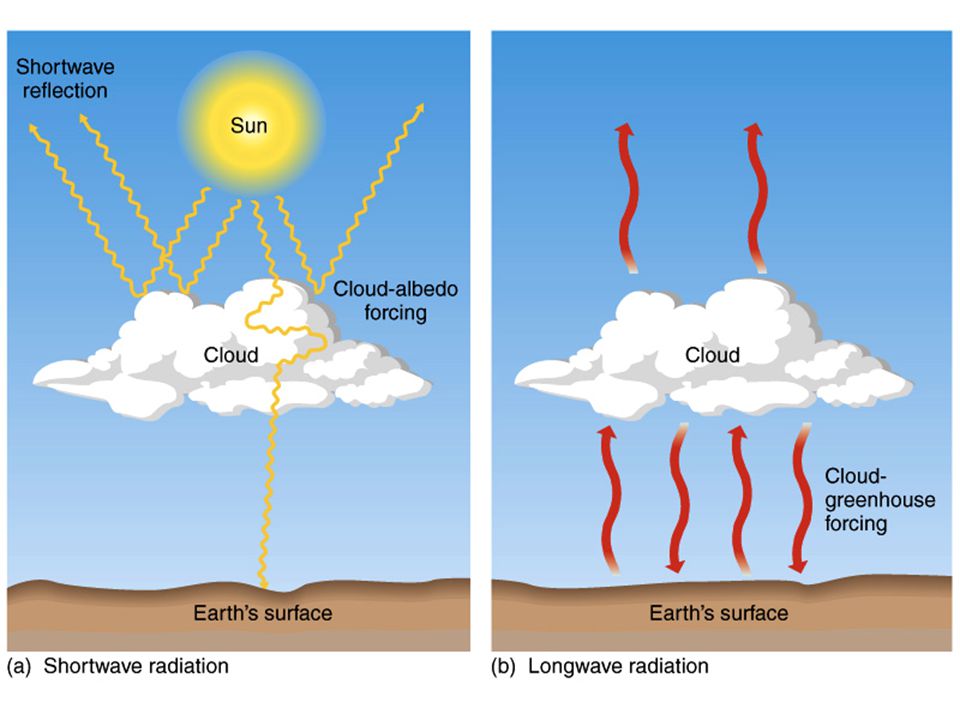
Low Clouds Very thick water clouds reflect large amounts of sunlight Very near the surface, temperature of the cloud effectively the same as surface. Infrared radiation is therefore about the same - almost like the cloud wasn’t there! NET EFFECT: Cooling

19
High Clouds Thin, cold ice clouds reflect less sunlight Extremely cold, emits infrared at colder temperatures, prevents warmer surface infrared from escaping to space NET EFFECT: Warming

21
Surface temperature changes from 1750 to 1990 Greenhouse gases onlyAerosols only Greenhouse gases and aerosolsGlobal and annual mean changes: Greenhouse gases only: 1.7 °C Aerosols only: -0.9 °C Greenhouse gases and aerosols: 0.6 °C Observed temperature increase over the last 140 years: 0.6 °C

22
Surface temperature changes from 1750 to 1990 from 1750 to 1990 Aerosols only (°C)
")
23
volatile organic carbon molecules CCN formation Cloud Formation Cloud Albedo Precipitation/ Water Stress Surface Temperature Hydrological Cycle

24
Elevated CO 2 stimulates photosynthesis Trees grow faster in elevated CO 2 and are bigger at the end of the experiment N concentrations are reduced No large changes in structure Stomatal conductance often is lower We know how trees respond to elevated CO 2 There is a wealth of data from many CO 2 enrichment studies demonstrating physiological responses of seedlings and young trees

Similar presentations


 Mixture of gases, solids, and liquids.>")
 Planetary Atmospheres I. Atmosphere: ◦ Layer of gas that surrounds a world Thin for terrestrial planets ◦ 2/3 of air within 10 km of.>")
>")


