Download presentation
Presentation is loading. Please wait.

1
Where (not) to measure rainfall Neil I. Fox University of Missouri - Columbia
 to measure rainfall Neil I. Fox University of Missouri - Columbia")
2
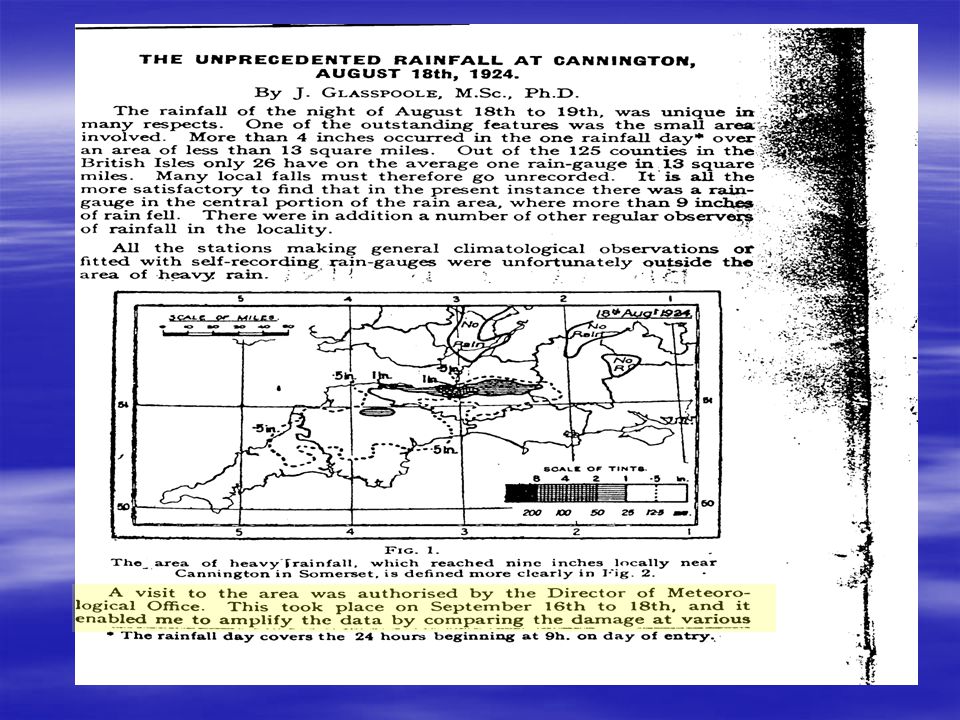
Three parts One problem with radar and three (possible) solutions –Microwave links –TV station radar –Corrections Using gauges?
 solutions –Microwave links –TV station radar –Corrections Using gauges")
3
Problems with radar Lots of problems with getting accurate estimates of precipitation rate Using dual-polarization should make estimates a lot better but… We are observing precip above the surface

4
Many things can happen Between the height of the beam and the surface Precip can evaporate It can grow It can be advected We may even be above the precip and not see it at all

5
Dealing with this Near to surface instruments More radars Radar correction

6
Nexrad coverage

7
Illustration of Wind-drift 1-dimensional view with constant shear profile in u-direction Notice that when wind- drift is applied the original pixel is spread to 2 neighboring pixels In the example none of the original rainfall contributes to the pixel directly below it

8
Data Sets Used for Case Study From the Sydney 2000 Games C-POL radar Wind Component Retrieval Methods from Sun and Crook (1994). CAPPI height 1500m, 45x45 grid, 2.5km grid spacing

9
U and V wind components

10
Results from Single Time Step The following images are taken from the midpoint of the event near Sydney. The comparison between the given reflectivity and the wind drift correction will be shown. There is a noticeable dispersion of reflectivity in the correction scheme

11
Reflectivity vs. Correction

12
Corrected Reflectivity Movie

13
Accumulation vs. Correction

14
Accumulation Error There is a noticeable area of underestimation on the western edge of storm as it tracks northeastward, coupled with an area of overestimation, on the order of 5-10km

15
Accumulation Error Movie

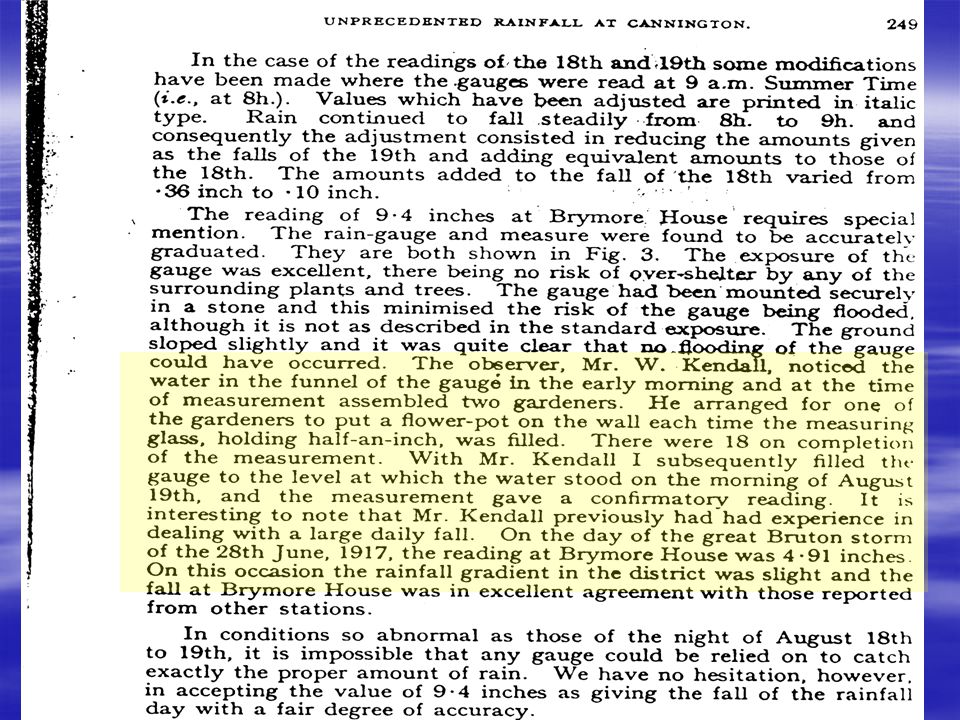
16
Introduce Topography

17
Wind drift plus topography Incorporating topography into the wind-drift scheme simply reduces the error between the original and wind drift correction, esp. in higher elevation Reduces the distance the wind impacts falling drops

18
Conclusions of this Errors predicted by this study are significant –Up to 30 millimeters in this case over the span of 6 hours (~100% error in some regions on the edge of the precipitation) –Convective cases result in higher accumulation errors than stratiform –Higher elevation reduces these errors Implications for assimilation into hydrological and meteorological models
 –Convective cases result in higher accumulation errors than stratiform –Higher elevation reduces these errors Implications for assimilation into hydrological and meteorological models")
19
Getting closer to the ground More radars Microwave attenuation Gauges

20
Use of broadcast radars Regular low-level PPI Flexibility when desired –But must put broadcasters’ needs first

21
Relative Beam heights St Louis: KLSX Fulton Pleasant Hill, KEAX

22
Benefits to be gained Low-level cold season precip Low-level modification of warm season precipitation Low-level and small-scale (high-resolution) rotation Boundaries
 rotation Boundaries")
23
Limitations Quality Control Calibration Staffing considerations Only PPI

24
Benefit to Broadcasters Publicity Community service Radar is not really used most of the time

25
S-band 1 Beamwidth 250kW 25m tower

26
Example from the tornado outbreak of 4 -10 May 2003 Numerous rotations spotted (and shown on TV) using the radar, but not detected by NWS radars Some (small) hook echo features clearly observable were not so clear with NWS radar imagery
 using the radar, but not detected by NWS radars Some (small) hook echo features clearly observable were not so clear with NWS radar imagery")
27
Chariton County is roughly 105 km from the radar site in Fulton and the beam height is roughly 1550 m. KEAX is 150 km: 2750 m. KLSX is 210 km away: 4300 m.

28
The Northern Audrain County Cell: From Fulton : 56 km @ 670 m From KEAX: 200km @ 4150 m From KLSX: 135 km @ 2300 m. The Boone County Cell: From Fulton: 48 km @ 550m. From KEAX: 165 km @ 3100 m. From KLSX: 160 km @ 2850 m

29
Making a problem useful: Microwave attenuation Microwave signals at the frequencies typically used for cellphones are strongly attenuated by precipitation

30
Bolton Project

31
Transmitter Receiver

32
Transmitter Receiver Effect of dumb clipart rain: differential attenuation

33
From Rahimi et al. submitted to JGR

34
Using gauges Gauges give us a measure of surface precipitation –At a point –They have bigger errors than you think

35
Especially when installed by council workmen

36
Using gauges 2 If we’re careful If we understand the errors If we recognize that we’re using gauges!

39
No cheese today Gromit

40
Poor Gromit – didn’t check the forecast

Similar presentations


 that may contain a stratiform rain region.>")

 Atlas (1989)>")
 P. Tabary Météo.>")


 Eric WATTRELOT & Jean-François MAHFOUF (Météo-France/CNRM/GMAP)>")


