Download presentation
Presentation is loading. Please wait.

1
Inquiry in the classroom Erik Froburg, Education Coordinator Carbon Cycle: Global to local Ruth Varner, PhD

2
Agenda Introduction to Inquiry Carbon Cycle Content Case study: Carbon Cycle game Lunch Carbon Cycle Content cont’d Case Study: Photosynthesis Using Cores to Observe the Earth System

3
Inquiry-based instruction derives from scientific inquiry Scientific inquiry refers to the diverse ways in which scientists study the natural world and propose explanations based on the evidence derived from their work. National Science Education Standards Students are asked to: Observe and describe objects and events Create explanations for their observations Manipulate objects and events to test various explanations Communicate ideas and findings to others

4
National Research Council, (2000). Inquiry and the National Science Education Standards: A guide for teaching and learning. Washington, D.C.: National Academy Press.

5
Student Knowledge and Skills School Context Teacher Knowledge and Skills State/National Assessments Goals of the Lesson Your choice of inquiry must balance the needs of:

6
A curriculum should employ methods from all parts of the inquiry spectrum. The appropriate level of inquiry is dependent upon many things, such as: Subject matter Time available Teaching objectives However, highly student-directed inquiry is most often neglected, so we tend to focus on it. There is no “right” level of inquiry

7
scaffolded and Inquiry needs to be scaffolded to meet the needs of both students and teachers StudentsTeachers May not have sufficient content background. May be uncomfortable not knowing results in advance. May not be comfortable with open-ended questions. May not feel that they have control over the content being learned. May not have the autonomy for self-directed work yet. May feel pressured by time constraints. May not know what is expected of them. May not like the unpredictability of inquiry.

8
It is good practice to occasionally analyze our own use of inquiry Where does this lesson fit into the inquiry continuum? Can I modify this lesson to make it more inquiry- based? Does my curriculum adequately represent all aspects of inquiry? Using a common yardstick (i.e. the Essential Features table) allows you to discuss and promote the use of inquiry amongst colleagues.
 allows you to discuss and promote the use of inquiry amongst colleagues..")
9
Summary Inquiry-based instruction follows the model of scientific inquiry employed by scientists. Inquiry in the classroom falls on a continuum from student- driven (more inquiry) to teacher-directed (less inquiry). Challenges to inquiry prevent (full) student-driven inquiry all of the time. Optimal rather than maximal solutions should be sought for introducing inquiry. Understanding and conducting inquiry is a part of the NC Science Competencies.
 to teacher-directed (less inquiry). Challenges to inquiry prevent (full) student-driven inquiry all of the time. Optimal rather than maximal solutions should be sought for introducing inquiry. Understanding and conducting inquiry is a part of the NC Science Competencies..")
10
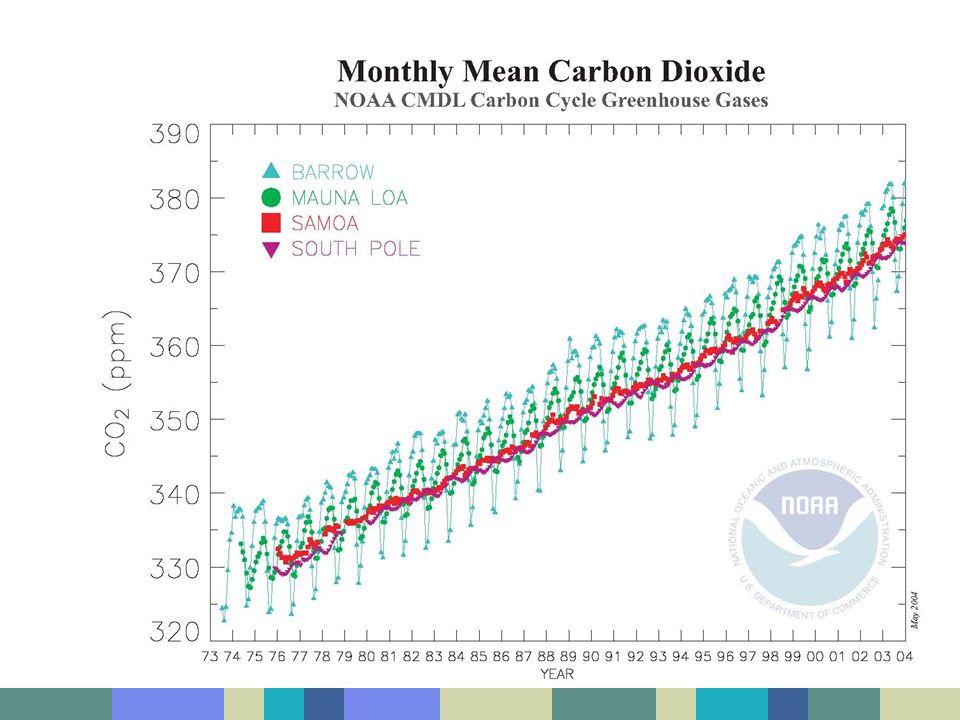
Atmospheric CO 2 at Mauna Loa Keeling, C.D. and T.P. Whorf. 2004. Atmospheric CO 2 records from sites in the SIO air sampling network. In Trends: A Compendium of Data on Global Change. Carbon Dioxide Information Analysis Center, Oak Ridge National Laboratory, U.S. Department of Energy, Oak Ridge, Tenn., U.S.A.

11
The Earth System The Earth is a system made up of components. There are feedbacks between these components. These relationships can be used to predict past and future changes in the environment. The Carbon cycle is an important Earth System.

13
Formation of Fossil Carbon Coal: from the remains of plants (mainly from Carboniferous period) Oil: from marine organisms that were buried under ocean or river sediments Natural Gas: was originally oil; higher temperature and pressure converted it to primarily methane
 Oil: from marine organisms that were buried under ocean or river sediments Natural Gas: was originally oil; higher temperature and pressure converted it to primarily methane")
15
Combustion Burning hydrocarbons produces CO 2 and CO: CxHx + O 2 CO 2 + H 2 O (if enough O 2 ) Complete combustion Hydrocarbon + oxygen = carbon dioxide and water CxHx + O 2 CO 2 + CO + H 2 O (if not enough O 2 ) incomplete combustion Hydrocarbon + oxygen = carbon dioxide and carbon monoxide and water
 Complete combustion Hydrocarbon + oxygen = carbon dioxide and water CxHx + O 2 CO 2 + CO + H 2 O (if not enough O 2 ) incomplete combustion Hydrocarbon + oxygen = carbon dioxide and carbon monoxide and water")
17
Photosynthesis – carbon fixed from inorganic CO 2 to organic molecules (sugars) 6 CO 2 + 6 H 2 O C 6 H 12 O 6 + 6 O 2 chlorophyll, sunlight Respiration – sugar is “burned” as part of a metabolic process that consumes oxygen and produces energy (ATP) – decomposition results in respiration C 6 H 12 O 6 + 6 O 2 6 CO 2 + 6 H 2 O + energy Biological uptake/release of CO 2
 6 CO H 2 O C 6 H 12 O O 2 chlorophyll, sunlight Respiration – sugar is burned as part of a metabolic process that consumes oxygen and produces energy (ATP) – decomposition results in respiration C 6 H 12 O O 2 6 CO H 2 O + energy Biological uptake/release of CO 2")
18
From the Atmosphere: Inorganic C in the Ocean CO 2 (atm) ↔ CO 2 (aq) ↔ HCO 3 - + H + ↔ CO 3 2- + H+ ↔ CaCO 3 ↔ seds
 ↔ CO 2 (aq) ↔ HCO H + ↔ CO H+ ↔ CaCO 3 ↔ seds")
19
Carbon dioxide in the oceans Calcareous skeleton carbon – can be dissolved or deposited

21
UNH/NOAA-PMEL CO 2 Buoy in Gulf of Maine In sea water In overlying atmosphere

25
Case study: Carbon Cycle game

27
Terrestrial Carbon Soil carbon is released through respiration : root and microbial (decomposition) Plants respire CO 2 Plants also fix carbon through photosynthesis
 Plants respire CO 2 Plants also fix carbon through photosynthesis")
28
Terrestrial Carbon Biological uptake/release of CO 2 Photosynthesis – carbon fixed from inorganic CO 2 to organic molecules (sugars) 6 CO 2 + 6 H 2 O C 6 H 12 O 6 + 6 O 2 chlorophyll, sunlight Respiration – sugar is “burned” as part of a metabolic process that consumes oxygen and produces energy– decomposition results in respiration C 6 H 12 O 6 + 6 O 2 6 CO 2 + 6 H 2 O + energy
 6 CO H 2 O C 6 H 12 O O 2 chlorophyll, sunlight Respiration – sugar is burned as part of a metabolic process that consumes oxygen and produces energy– decomposition results in respiration C 6 H 12 O O 2 6 CO H 2 O + energy")
29
Global network of flux towers used to measure CO 2 exchange between ecosystems and the atmosphereGlobal network of flux towers used to measure CO 2 exchange between ecosystems and the atmosphere Sites also include measurements on vegetation, soils, hydrology and meteorology.Sites also include measurements on vegetation, soils, hydrology and meteorology. Information available to researchers, students and educators.Information available to researchers, students and educators. F LUXNET

30
http://www.fluxnet.ornl.gov/fluxnet/index.cfm

31
Total ecosystem respiration = R soil + R leaf + R stem + R cwd Rsoil Rstem Rleaf Rcwd

32
R soil = R root + R decomp Soil CO 2 efflux is a measurement of the R soil that reaches the atmosphere

33
Measuring Soil CO 2 Efflux Manual chamber measurements Autochamber measurements

34
Volcanos Subduction of limestone at plate boundaries Carbonotype: watery low temperature lava

35
Oceans +2 Pg yr -1 Atmosphere +2 Pg yr -1

36
FACE Duke Forest, Chapel Hill, NC Carbon Fertilization ?

37
FACE site locations

38
Case Study: Photosynthesis

39
Using cores to analyze the Earth System

40
To determine the ecosystem history of the area and the impacts of changes in riverine flow. An understanding of natural cycles of change prior to significant human disturbance allows land managers to set realistic performance measures and targets for salinity and other water quality and quantity measures. Sediment Cores from the Southwest Coastal Area, Everglades National Park, Florida

41
~1900 years old

42
http://oceanworld.tamu.edu/resources/oceanography-book/evidenceforwarming.htm The oxygen isotope ratio and the hydrogen isotope ratios give the temperature at which H 2 O condensed as water or snow on the surface of the ice sheet. Air bubbles trapped in the ice gives atmospheric gas content, especially the concentration of carbon dioxide (CO 2 ) Dust content in the ice indicates windiness over land upwind of the ice sheet. Salt content in the ice indicates windiness over the ocean upwind of the ice sheet. Sulphuric acid (H 2 SO 4 ) content of the ice depends on volcanic activity. Learn more about evidence collected from ice cores by reading Deciphering Mysteries of Past Climate From Antarctic Ice Cores. (http://www.globalchange.umich.edu/globalchange1/current/labs/Lab9/Vostok.htm)Deciphering Mysteries of Past Climate From Antarctic Ice Cores.http://www.globalchange.umich.edu/globalchange1/current/labs/Lab9/Vostok.htm Ice Cores
 Dust content in the ice indicates windiness over land upwind of the ice sheet. Salt content in the ice indicates windiness over the ocean upwind of the ice sheet. Sulphuric acid (H 2 SO 4 ) content of the ice depends on volcanic activity. Learn more about evidence collected from ice cores by reading Deciphering Mysteries of Past Climate From Antarctic Ice Cores. ( Mysteries of Past Climate From Antarctic Ice Cores. Ice Cores.")
44
Radial/cross section from a giant sequoia log (Sequoiadendron giganteum) http://www.koshland-science-museum.org/exhibitgcc/historical08.jsp Long-term, quantitative temperature and precipitation records can be determined from tree rings.
 Long-term, quantitative temperature and precipitation records can be determined from tree rings.")
45
http://www.yale.edu/fes519b/saltonstall/trmmdata.htm

46
http://lh5.ggpht.com/_86eqKXBZMaw/RsPNBLX1BCI/AAAAAAAAADs/enILirRyRT4/APE1_D1.jpg

47
Little Ice Age: 1400-1800 A.D. LIA European Settlement in Canada

48
The Great Dismal Swamp: Carbon cycle history

Similar presentations


 Carbonate rocks (limestone and coral = CaCO 3 ) Deposits of Fossil fuels Carbon exists in the nonliving.>")
 Carbonic acid ( HCO 3 − ) Carbonate rocks (limestone and coral.>")


