Download presentation
Presentation is loading. Please wait.

1
Echocardiographic assessment of stenotic valvular lesions
Dr Nithin P G

2
Layout of seminar Basic considerations
Volumetric flow calculations Continuity equation Bernoulli equation & Pressure Gradients Pressure Half Time & Deceleration time Proximal Isovelocity Surface Area method Assessment of common stenotic lesions MS AS TS PS

3
Basic consideration

4
Volumetric flow calculations
D (h) = v x t D (h) = D (h) = Area under curve= VTI Q= Cross sectional Area x VTI
 = v x t. D (h) = D (h) = Area under curve= VTI. Q= Cross sectional Area x VTI.")
5
Volumetric flow calculations
Limitations Assumptions Flow through rigid circular tube [elastic] Uniform velocity across the vessel Derived CSA is circular [AV valves elliptical] CSA constant throughout the flow SV remains in constant position throughout Errors in VTI measurements Inadequate beam alignment Failure to correctly trace the VTI [ leading edge in A,P modal velocity in M,T] 3-5 beats in SR, bts in AF Incorrect gain settings and filter settings Errors in diameter measurements Wrong phase of cardiac cycle Inconsistent annulus measurement

6
Continuity equation QLVOT= Qthru all chambers
ALVOT x VTILVOT = Apoint x VTIpoint Apoint = ALVOT x VTILVOT VTIpoint = p D2 x VTILVOT VTIpoint = D2 x VTILVOT No intracardiac shunts between the two points No significant regurgitant flow

7
Continuity equation Limitations Limitations in measurement of flow
Intracardiac shunts Regurgitation flow Low cardiac output

8
P1, v1 Bernoulli equation P2, v2 D P= 4V2
Peak Pressure Grad = 4 x (Vmax)2 Mean PG = 4 x (∑V1²+V2²+…Vn²) n MPG=[∆P(max)/1.45 ]+2 MPG=2.4(Vmax)²
2. Mean PG = 4 x (∑V1²+V2²+…Vn²) n. MPG=[∆P(max)/1.45 ]+2. MPG=2.4(Vmax)².")
9
Bernoulli equation & Pressure Gradients

10
Bernoulli equation & Pressure Gradients
Pressure recovery phenomenon

11
Bernoulli equation & Pressure Gradients

12
Bernoulli equation & Pressure Gradients
HR=72 HR=100

13
Pressure Half Time & Deceleration time

14
Pressure Half Time & Deceleration time
PHT- time required by the pressure to decay to half its original value [ velocity to V/1.414] MVA= 220/PHT DT- Time taken for peak early diastolic velocity to fall to zero [ PHT= 0.29 x DT] MVA= 759/DT

15
Pressure Half Time & Deceleration time
Advantages Not affected by low cardiac output Not affected by coexisting MR Limitations Affected by LV compliance, Peak Pressure gradients Post BMV Severe AR [elev. LVEDP shortens PHT] Severe LVH- ↓LV compliance Misinterpretation b/w AR velocity and MS signal [ MS after IVRT] Prosthetic mitral valve- not validated

16
Proximal Isovelocity Surface Area method
QAlias= AAlias x VAlias QAlias= 2pr2 x VN QAlias= QOrif = AOrif x VOrif AOrif = 2pr2 x VN VOrif Stenotic orifice area

17
Proximal Isovelocity Surface Area method
Angle correction Flow can only converge from an angle of a Corrected Formulae MVA= 2pr2 x VN x a Vorif

18
Proximal Isovelocity Surface Area method
Advantages Mitral valve calcification MR/AR Accurate and reliable Disadvantages Peak velocity (E) rather than integration of flow over the entire diastolic period Vena contracta= effective orifice area < anatomical orifice Radius measurement calculation Accurate measurement required Low Aliasing velocity will reduce accuracy
 rather than integration of flow over the entire diastolic period. Vena contracta= effective orifice area < anatomical orifice. Radius measurement calculation. Accurate measurement required. Low Aliasing velocity will reduce accuracy.")
19
Assessment of Common stenotic lesions

20
Mitral Stenosis

21
Mitral Stenosis RHD Commissural fusion⇒doming/bowing
Chordal thickening ⇒ abnormal motion Progressive fibrosis⇒stiffening ⇒calcification Doming of the mitral valve (hockey stick AML) Funnel shaped opening of mitral valves Focal thickening and beading of leaflets Calcification
 Funnel shaped opening of mitral valves. Focal thickening and beading of leaflets. Calcification.")
22
M-mode assessment Increased echoes from thickened, deformed, calcified leaflets Decreased opening amplitude of the valve Anterior motion of the posterior leaflet Decrease in the initial diastolic leaflet closure (E-F slope) [>80mm/s⇒MVA =4-6cm², <15mm/s⇒MVA <1.3cm²] Left atrial enlargement is usually also readily apparent on M-mode Mitral valve annular calcification can also be detected on M-mode Decrease in the initial diastolic leaflet closure (E-F slope) [>80mm/s⇒MVA =4-6cm², <15mm/s⇒MVA <1.3cm²]
 [>80mm/s⇒MVA =4-6cm², <15mm/s⇒MVA <1.3cm²] Left atrial enlargement is usually also readily apparent on M-mode. Mitral valve annular calcification can also be detected on M-mode. Decrease in the initial diastolic leaflet closure (E-F slope) [>80mm/s⇒MVA =4-6cm², <15mm/s⇒MVA <1.3cm²]")
23
Severity of MS The normal adult mitral valve area (MVA) is 4 to 6 cm² in CSA Severe MS when, MVA of < 1.0 cm²- severe MS PHT> 220 Mean Gradient >10 Mild Moderate Severe

24
Assessment of severity
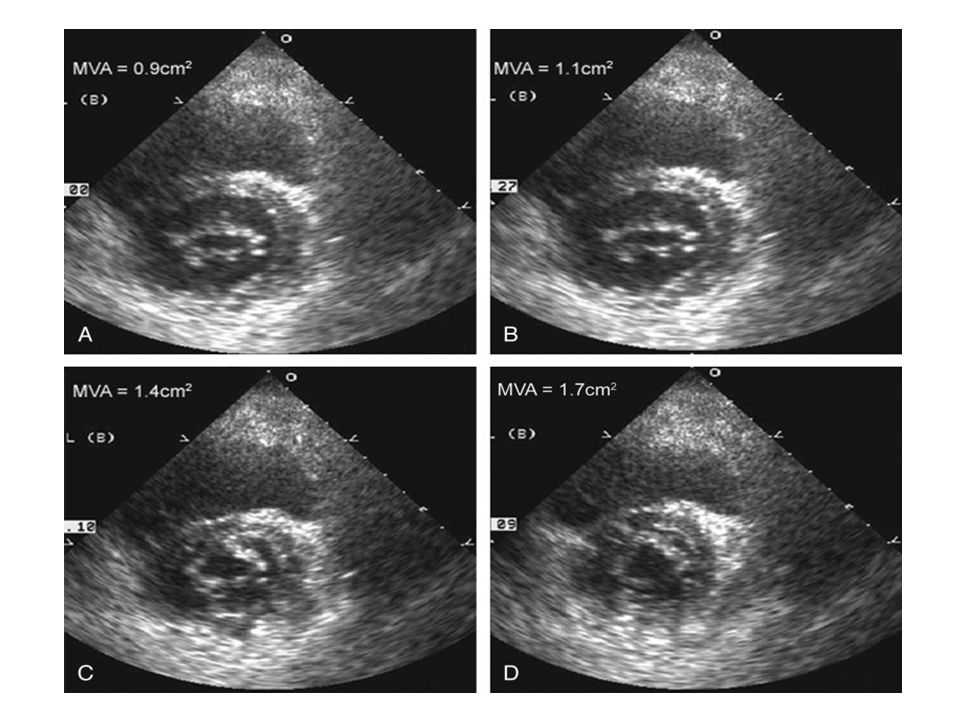
I. 2D-Planimetry 2D short axis imaging of diastolic orifice-planimetry Smallest orifice at the leaflet tips Inner edge of the black/white interface traced Correlates well with hemodynamic assessment

25
Assessment of severity
Funnel-shaped- Actual limiting orifice at the tip Instrumentation setting- ‘’blooming” of the echoes due to increased gain [operator—dependent] Proper alignment of the imaging plane relative to valve orifice is critical The orifice should be measured during initial diastole when the valve is maximally distended Appropriate receiver gain settings are necessary The orifice should appear fish mouthed Good lateral resolution is necessary to identify the medial and lateral margins correctly. Planimetry has decreased accuracy in the setting of valvular thickening and calcification, chest deformity and previous commissurotomy

27
Assessment of severity
Method for determining the correct level for planimetry Step 1- Direct the scan plane to the level of papillary muscle Step 2- Angle the transducer slightly medially & tilt superiorly until the tips of mitral leaflets are identified [ corres. to the smallest MVA] Step 3- Freeze the image in early diastole Step 4- Trace the MVA along the inner margins of the leaflets

28
Assessment of severity
II. PHT or DT Method for calculating the MVA by PHT & DT Step 1- Optimize the CW Doppler Signal through the mitral valve [usually the best from apical window, colour flow imaging] Step 2- Measure the peak E velocity [Vpeak] Step 3- Determine the PHT point on the EF slope where V becomes Vpeak / 1.414 Step 4- Draw vertical lines from baseline to Vpeak & PHT point Step 5- Measure the time interval between the vertical lines [= PHT] Step 6- Trace the EF slope till it touches the baseline, measure the time interval from Vpeak to this point [=DT] Step 7- Calculate MVA [220/PHT or 759/DT]

29
Assessment of severity
PHT or DT Tracing A normal range of PHT is 20 – 60msec MS have PHT > 90msec

30
Assessment of severity
III. PISA Method for calculating the MVA by PISA Step 1- Zoom the area of the mitral valve from the apical four-chamber view. Step 2- Use colour flow imaging of the mitral stenosis jet and upward shift of the zero baseline for colour map (30- to 45-cm/s aliasing velocity). Step 3- Freeze colour flow images in a cine loop and identify an optimal frame to measure radius (r) of PISA in the LA. Step 4- Determine the angle (a) between two mitral leaflets at the atrial surface and use the following formula: MVA= 2pr2 x VN x a Vpeak
. Step 3- Freeze colour flow images in a cine loop and identify an optimal frame to. measure radius (r) of PISA in the LA. Step 4- Determine the angle (a) between two mitral leaflets at the atrial surface. and use the following formula: MVA= 2pr2 x VN x a. Vpeak 180.")
31
Assessment of severity
Adjusting Aliasing velocity

32
Assessment of severity
IV. Continuity Equation Method for calculating the MVA by Continuity Equation Step 1-Measure the CSA in cm2 of LVOT [ from PLAX view measure the LVOT Dia., during systole, inner edge to inner edge; CSA= x D2] Step 2- Measure VTI of LVOT [ from A5C view, PW doppler, SV just proximal to aortic valve, systole, trace leading edge velocity for VTI ] Step 3- Measure VTI of MS [from A4C view, CW doppler, trace modal velocity VTI] Step 4- Calculate MVA using the following formula: CSALVOT x VTILVOT VTIMS

33
Assessment of severity
V. Pressure Gradients Method for calculating the MV Gradients Step 1-Optimize the CW Doppler Signal through the mitral valve [usually the best from apical window, colour flow imaging] Step 2- Measure the peak E velocity [Vpeak]. Peak PG= 4 Vpeak2 Step 3- Trace the velocity signal of MS to get the mean PG. Step 4- Mention the heart rate at which measurement taken

34
Assessment of severity
TECHNIQUE METHOD REMARKS Planimetry Measurement in short axis view Operator dependent, decreased accuracy in setting of calcification or prev. commisurotomy Pressure half time (Pt½ ) MVA= 220/ Pt½ where Pt½ =0.29 x Deceleration time Unreliable in conditions with elevated LVEDP (MR, AI, recent PBMV) Continuity Equation MVA=D2 LVOT x 0.785x TVI LVOT /TVI MV In regurgitant lesions reliability decreases PISA (Proximal Iso -velocity Surface Area) MVA= 2πr2 x V Very reliable, operator dependent
 MVA= 220/ Pt½ where Pt½ =0.29 x Deceleration time. Unreliable in conditions with elevated LVEDP (MR, AI, recent PBMV) Continuity Equation. MVA=D2 LVOT x 0.785x TVI LVOT /TVI MV. In regurgitant lesions reliability decreases. PISA (Proximal Iso -velocity Surface Area) MVA= 2πr2 x V. Very reliable, operator dependent.")
35
Secondary features of MS
LA dilation AF Spontaneous echo contrast LA thrombus Secondary pulmonary HTN-TR

36
Echo approach to MS Valve morphology, etiology
Exclude other causes of clinical presentation MS severity Peak & Mean PG 2D valve area MVA by PHT, Continuity, PISA Assosiated MR LA enlargement/ clots Pulmonary art pressure Co-existing TR severity Assessment for BMV

37
Individuals with score≤8 –excellent for BMV
Those with score≧12-less satisfactory results

39
Tricuspid Stenosis Normal inflow velocity < 0.5-1m/sec, mean gradient < 2 mm Hg. Respiratory variation in inflow velocity [ increased during inspiration]. Best measured with breath held in expiration 2D-Planimetry cannot be used Severe when mean PG > 7 mm Hg or PHT > 190 msec

40
AORTIC VALVE Trileaflet valve Normal valve area-3-4 cm² Severity of Aortic Stenosis Mild Moderate Severe

41
AVA-Direct planimetry
Rarely are all 3 leaflets imaged perpendicular Triangular shape- measurement error Deformities & irregularities- further exacerbates AoV- superior-inferior rapid moments

42
Assessment of severity
I. Continuity Equation Method for calculating the MVA by Continuity Equation Step 1-Measure the CSA in cm2 of LVOT [ from PLAX view measure the LVOT Dia., during systole, inner edge to inner edge; CSA= x D2] Step 2- Measure VTI of LVOT [ from A5C view, PW doppler, SV just proximal to aortic valve, systole, trace leading edge velocity for VTI ] Step 3- Measure VTI of AS [from multiple views , A5C view, CW doppler, trace modal velocity VTI] Step 4- Calculate MVA using the following formula: CSALVOT x VTILVOT VTIAS

43
Assessment of severity
II. Pressure Gradients Method for calculating the Pressure Gradients Step 1-Optimize the CW Doppler Signal through the aortic valve [usually from apical 5C window, colour flow imaging] Step 2- Measure the peak velocity [Vpeak]. Peak PG= 4 Vpeak2 Step 3- Trace the velocity signal of AS to get the mean PG. Step 4- Mention the heart rate at which measurement taken

44
Assessment of Severity
Discrepancies Technically poor doppler recording Non parallel interrogation angle Pressure gradients depends on HR, flow rate & valve narrowing –AR/LV dysfunction

45
Assessment of Severity
Dobutamine Echo Aortic valve area depends on Aortic flow rate Distinguish- true severe valvular stenosis vs mild to mod stenosis with LV dysfunction Stepwise infusion of dobutamine(5—30µg/kg/min) Lack of contractile reserve- Failure of LVEF to ↑ by 20% is a poor prognostic sign
 Lack of contractile reserve- Failure of LVEF to ↑ by 20% is a poor prognostic sign.")
46
Normal LV , AS Abnormal LV , AS

47
Assessment of Severity
Maximal aortic cusp separation (MACS) on M-mode Vertical distance between RCC and NCC during systole Stenotic Aortic Valve → decreased MACS Limitations Single dimension Asymmetrical AV involvement Calcification / thickness ↓ LV systolic function ↓ CO status AVA MACS N > 2cm2 N > 15 mm < cm2 < 8 mm > 1 cm2 > 12 mm gray area 8 – 12 mm
 on M-mode. Vertical distance between RCC and NCC during systole. Stenotic Aortic Valve → decreased MACS. Limitations. Single dimension. Asymmetrical AV involvement. Calcification / thickness. ↓ LV systolic function. ↓ CO status. AVA. MACS. N > 2cm2. N > 15 mm. < 0.75 cm2. < 8 mm. > 1 cm2. > 12 mm. gray area. 8 – 12 mm.")
48
Assessment of Severity
Ao valve resistance- Has a good correlation with AVA for a given aortic velocity. Resistance=28/ AVA x √gradient( mean) =(∆P/∆Q)mean x1333 Dimensionless index [DI] DI =VTILVOT / VTIAortic If DI < 0.25 for native valve, then critical stenosis
 =(∆P/∆Q)mean x1333. Dimensionless index [DI] DI =VTILVOT / VTIAortic. If DI < 0.25 for native valve, then critical stenosis.")
49
Discrepancies in AS severity assessment
AS by gradient Gradient lower than expected Reduced EF Significant MR Gradient higher than expected Significant AR High Output states like anemia, fever AS by continuity Equation Associated subvalvular obstruction [higher LVOT velocities, abnormal measurements]; [AR not C.I.] LVOT TVI- SV -just behind AoV Suboptimal LVOT measurements Low Trans Aortic flow rate Low EF Small ventricular chamber Mod-severe MR

50
Echo approach to AS Valve anatomy, etiology Exclude other LVOTO
Stenosis severity jet velocity mean pressure gradient AVA – continuity equation LV Dimensions/ hypertrophy/ EF/ diastolic fn Aorta Aortic diameter/ annulus diameter/ assess COA AR – quantification if more than mild Associated MR- mechanism & severity Pulmonary artery pressure

51
Pulmonary stenosis Isolated or associated with other congenital lesions Jet velocity > 4 m/sec or maximum gradient > 60 mm Hg Prominent a waves in M-mode tracing P V Pressure gradient A wave amplitude Nil 2-7 mm < 50 mm Hg 2-10 (6) mm >50 mm Hg 6-18 (10) mm
 mm. >50 mm Hg (10) mm.")
52
Thank you

Similar presentations


 Continuous Wave 2) Pulse Wave 3) Color Flow DOPPLER ULTRASOUND.>")
. - a spherical occluder is contained by metal.>")


