Download presentation
Presentation is loading. Please wait.

1
Environmental Indicator Report 2012 Meeting on Environmental Assessments 16-17 April 2013

2
[2] Our state of environment report (SOER 2010) stresses a familiar message: there has been progress, but not enough ‘Environmental policy has delivered substantial improvements […] however, major environmental challenges remain which will have significant consequences […] if left unaddressed.’ Source: SOER 2010 ‘What differs […] is an enhanced understanding of the links between environmental challenges and with unprecedented global megatrends. This has allowed a deeper appreciation of the human-made systemic risks and […] insight into the shortcomings of governance.’ Source: SOER 2010
![[2] Our state of environment report (SOER 2010) stresses a familiar message: there has been progress, but not enough ‘Environmental policy has delivered substantial improvements […] however, major environmental challenges remain which will have significant consequences […] if left unaddressed.’ Source: SOER 2010 ‘What differs […] is an enhanced understanding of the links between environmental challenges and with unprecedented global megatrends.](http://images.slideplayer.com/15/4703372/slides/slide_2.jpg "This has allowed a deeper appreciation of the human-made systemic risks and […] insight into the shortcomings of governance.’ Source: SOER")
3
Characterisation of key challenges Key featuresIn the spotlight in Policy approaches (examples) Punctual linear cause-effect large (point) sources often local 1970s / 1980s (continuing today) targeted policies and single-issue instruments Diffuse cumulative causes multiple sources often regional 1980s / 1990s (continuing today) policy integration and raising public awareness Systemicsystemic causes interlinked sources often global 1990s / 2000s (continuing today) policy coherence and systemic approaches (a green economy?) [3] Over time, our understanding of environmental challenges and their underlying causes has evolved
![Characterisation of key challenges Key featuresIn the spotlight in Policy approaches (examples) Punctual linear cause-effect large (point) sources often local 1970s / 1980s (continuing today) targeted policies and single-issue instruments Diffuse cumulative causes multiple sources often regional 1980s / 1990s (continuing today) policy integration and raising public awareness Systemicsystemic causes interlinked sources often global 1990s / 2000s (continuing today) policy coherence and systemic approaches (a green economy ) [3] Over time, our understanding of environmental challenges and their underlying causes has evolved](http://images.slideplayer.com/15/4703372/slides/slide_3.jpg "Characterisation of key challenges Key featuresIn the spotlight in Policy approaches (examples) Punctual linear cause-effect large (point) sources often local 1970s / 1980s (continuing today) targeted policies and single-issue instruments Diffuse cumulative causes multiple sources often regional 1980s / 1990s (continuing today) policy integration and raising public awareness Systemicsystemic causes interlinked sources often global 1990s / 2000s (continuing today) policy coherence and systemic approaches (a green economy ) [3] Over time, our understanding of environmental challenges and their underlying causes has evolved")
4
[4] SOER 2010 offers reflections on future environmental priorities - four ‘I‘ provide headings for strategic action Implementation Better implementation and further strengthening of current environmental priorities Integration Coherent integration of environmental consideration across the many sectoral policy domains Inter-linkages Dedicated management of natural capital and ecosystem services (increasing resource efficiency and resilience) International dimension Transform to a green economy to manage natural capital sustainably within Europe … and beyond
![[4] SOER 2010 offers reflections on future environmental priorities - four ‘I‘ provide headings for strategic action Implementation Better implementation and further strengthening of current environmental priorities Integration Coherent integration of environmental consideration across the many sectoral policy domains Inter-linkages Dedicated management of natural capital and ecosystem services (increasing resource efficiency and resilience) International dimension Transform to a green economy to manage natural capital sustainably within Europe … and beyond](http://images.slideplayer.com/15/4703372/slides/slide_4.jpg "[4] SOER 2010 offers reflections on future environmental priorities - four ‘I‘ provide headings for strategic action Implementation Better implementation and further strengthening of current environmental priorities Integration Coherent integration of environmental consideration across the many sectoral policy domains Inter-linkages Dedicated management of natural capital and ecosystem services (increasing resource efficiency and resilience) International dimension Transform to a green economy to manage natural capital sustainably within Europe … and beyond")
5
[5] At the core of a green economy is a dual challenge: improving resource efficiency and ensuring resilience Human well-being (social and human capital) goal: enhance social equity and fair burden-sharing Ecosystem (natural capital) goal: ensure ecological resilience Economy (produced capital) goal: improve resource efficiency GREEN ECONOMY
![[5] At the core of a green economy is a dual challenge: improving resource efficiency and ensuring resilience Human well-being (social and human capital) goal: enhance social equity and fair burden-sharing Ecosystem (natural capital) goal: ensure ecological resilience Economy (produced capital) goal: improve resource efficiency GREEN ECONOMY](http://images.slideplayer.com/15/4703372/slides/slide_5.jpg "[5] At the core of a green economy is a dual challenge: improving resource efficiency and ensuring resilience Human well-being (social and human capital) goal: enhance social equity and fair burden-sharing Ecosystem (natural capital) goal: ensure ecological resilience Economy (produced capital) goal: improve resource efficiency GREEN ECONOMY")
6
[6] What do we mean by ecosystem resilience? Ecosystem (natural capital) goal: ensure ecosystem resilience The capacity of an ecosystem to tolerate disturbance without collapsing into a (qualitatively) different state. The notion of ecosystem resilience builds on capacity to resist change, ability to retain on structure and function despite change, ability to reorganise following disturbance. Concept of ecosystem resilience can be linked with discussion about environmental state, global tipping points, planetary boundaries.
![[6] What do we mean by ecosystem resilience.](http://images.slideplayer.com/15/4703372/slides/slide_6.jpg "Ecosystem (natural capital) goal: ensure ecosystem resilience The capacity of an ecosystem to tolerate disturbance without collapsing into a (qualitatively) different state. The notion of ecosystem resilience builds on capacity to resist change, ability to retain on structure and function despite change, ability to reorganise following disturbance. Concept of ecosystem resilience can be linked with discussion about environmental state, global tipping points, planetary boundaries..")
7
[7] What do we mean by resource efficiency? Economy (produced capital) goal: improve resource efficiency Simply put, resource efficiency compares resource inputs to economic outputs. The EU aims to be a resource efficient economy that ‘is competitive, inclusive and provides a high standard of living with much lower environmental impacts‘. Concept of improving resource efficiency is linked to environmental pressures and ‘decoupling‘ of economy growth.
![[7] What do we mean by resource efficiency.](http://images.slideplayer.com/15/4703372/slides/slide_7.jpg "Economy (produced capital) goal: improve resource efficiency Simply put, resource efficiency compares resource inputs to economic outputs. The EU aims to be a resource efficient economy that ‘is competitive, inclusive and provides a high standard of living with much lower environmental impacts‘. Concept of improving resource efficiency is linked to environmental pressures and ‘decoupling‘ of economy growth..")
8
One of key tasks of the EEA is ‘to publish a report on the state of, trends in and prospects for the environment every five years, supplemented by indicator reports focusing on specific issues’. (Regulation (EC) No 401/2009, Art 2(k)). EEA hosts more than 200 environmental indicators across 12 environmental themes. The European Environment Agency (EEA) provides objective, reliable and comparable information Environmental scenarios indicators (45 / 0 CSI) Land & Soil indicators (2/ 2 CSI) Transport indicators (38 / 3 CSI) Climate change indcators (42+4 / 5 CSI) Water indicators (7+7 / 7 CSI) Energy indicators (29 / 5 CSI) Tourism indicators (7 / 0 CSI) Air pollution indicators (6+5 / 5 CSI) Biodiversity indicators (25+2 / 3 CSI) Waste indicators (2 / 2 CSI) Fisheries indicators (3 / 3 CSI) Agriculture indicators (2 / 2 CSI) EEA core indicators (37 CSI) Based on Monitoring->Data->Indicators->Assessment->Knowledge chain.
 No 401/2009, Art 2(k)). EEA hosts more than 200 environmental indicators across 12 environmental themes. The European Environment Agency (EEA) provides objective, reliable and comparable information Environmental scenarios indicators (45 / 0 CSI) Land & Soil indicators (2/ 2 CSI) Transport indicators (38 / 3 CSI) Climate change indcators (42+4 / 5 CSI) Water indicators (7+7 / 7 CSI) Energy indicators (29 / 5 CSI) Tourism indicators (7 / 0 CSI) Air pollution indicators (6+5 / 5 CSI) Biodiversity indicators (25+2 / 3 CSI) Waste indicators (2 / 2 CSI) Fisheries indicators (3 / 3 CSI) Agriculture indicators (2 / 2 CSI) EEA core indicators (37 CSI) Based on Monitoring->Data->Indicators->Assessment->Knowledge chain..")
9
Assessment based on existing environmental indicators; no new ‘green economy‘ indicators have been developed. Pressure indicators to illustrate resource efficiency; State indicators to illustrate ecosystem resilience. Six thematic indicator-based assessments: Nitrogen emissios and threats to biodiversity Carbon emissions and climate change Air pollution and air quality Maritime activties and the marine environment Water use and water stress Use of material resources and waste management [8] Environmental indicator report 2012 shows progress in meeting dual challenge (resilience & resource efficiency) D P S I R
 D P S I R.")
10
[9] Examples from environmental indicator report 2012 - Chapter 5 (carbon emissions and climate change) Carbon and climate Pressure: GHG emissions [CSI 010]State: Average temperature [CSI 012] Sector: Renewable energy [ENER 29]
![[9] Examples from environmental indicator report Chapter 5 (carbon emissions and climate change) Carbon and climate Pressure: GHG emissions [CSI 010]State: Average temperature [CSI 012] Sector: Renewable energy [ENER 29] ](http://images.slideplayer.com/15/4703372/slides/slide_10.jpg "[9] Examples from environmental indicator report Chapter 5 (carbon emissions and climate change) Carbon and climate Pressure: GHG emissions [CSI 010]State: Average temperature [CSI 012] Sector: Renewable energy [ENER 29] ")
12
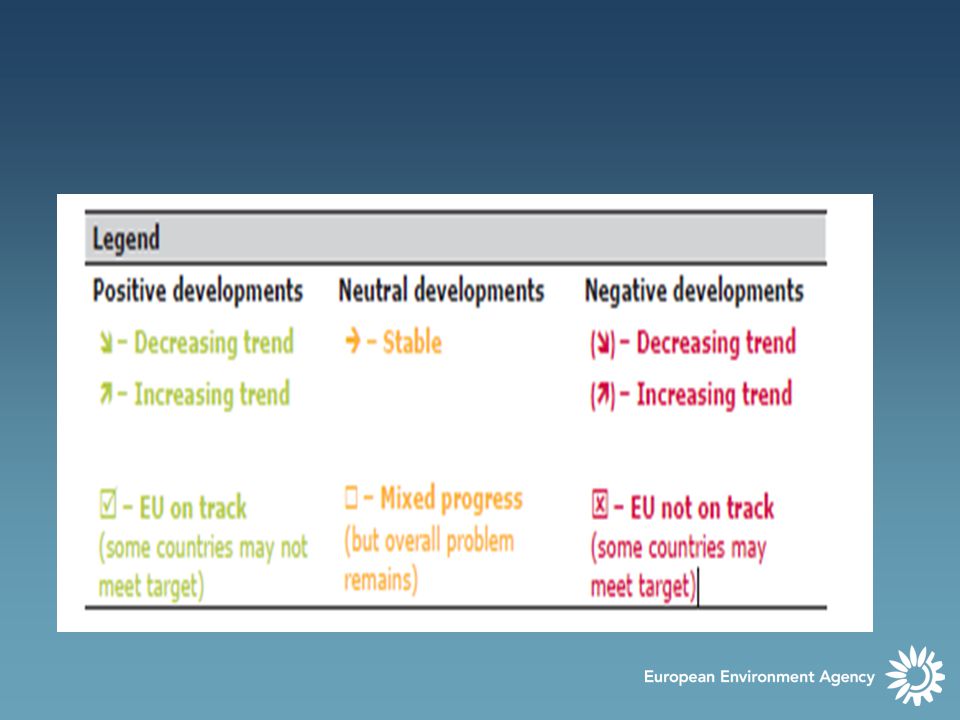
Environmental issue EEA 38 - trend? EU 27 target / objective - which? EU 27 - on track? Transboundary air pollution (NO X, NMVOC, SO 2, NH 3 ) To limit emissions of acidifying, and eutrophying pollutants Greenhouse gas emissions To reduce greenhouse gas emissions by 20 % by 2020 Air pollution To limit emissions of ozone precursor pollutants Maritime transport emissions To reduce greenhouse gas emissions Water use N.A. Decoupling and recycling (decouple resource use from economic growth) To decouple resource use from economic growth; to move towards a recycling society [10] Summing up: environmental ‘pressure‘ indicators to illustrate progress in improving resource efficiency
 To limit emissions of acidifying, and eutrophying pollutants Greenhouse gas emissions To reduce greenhouse gas emissions by 20 % by 2020 Air pollution To limit emissions of ozone precursor pollutants Maritime transport emissions To reduce greenhouse gas emissions Water use N.A. Decoupling and recycling (decouple resource use from economic growth) To decouple resource use from economic growth; to move towards a recycling society [10] Summing up: environmental ‘pressure‘ indicators to illustrate progress in improving resource efficiency.")
13
Environmental issue EEA 38 - trend? EU 27 target / objective - which? EU 27 - on track? Conservation status (safeguard EU’s most important habitats and species) To achieve favourable conservation status, set up Natura 2000 network Global mean temperature change ()() To limit increases to below 2°C globally Air quality in urban areas (particulate matter and ozone) To attain levels of air quality that do not give rise to negative health impacts Biodiversity loss (marine species and habitats) ()() To reverse negative species abundance trends Water stress (water exploitation) To achieve good quantitative status of water bodies Ecological footprint (footprint versus biocapacity) N.A. Links between environmental challenges & global context - indicators related to status / ecological resilience [11] Summing up: environmental ‘state‘ indicators to illustrate whether we are ensuring ecosystem resilience
 To achieve favourable conservation status, set up Natura 2000 network Global mean temperature change ()() To limit increases to below 2°C globally Air quality in urban areas (particulate matter and ozone) To attain levels of air quality that do not give rise to negative health impacts Biodiversity loss (marine species and habitats) ()() To reverse negative species abundance trends Water stress (water exploitation) To achieve good quantitative status of water bodies Ecological footprint (footprint versus biocapacity) N.A. Links between environmental challenges & global context - indicators related to status / ecological resilience [11] Summing up: environmental ‘state‘ indicators to illustrate whether we are ensuring ecosystem resilience.")
14
By and large, European environmental policies appear to have had a clearer impact on improving resource efficiency than on maintaining ecosystem resilience. Environmental indicators highlight that improving resource efficiency remains necessary, but in itself is not sufficient to ensure a sustainable natural environment. In a green economy policy context, there would be value in considering objectives and targets that more explicitly recognise the links between resource efficiency, ecosystem resilience and human well-being. [12] Reflections on progress towards resource efficiency, ecosystem resilience and a green economy in Europe

15
Thank you adriana.gheorghe@eea.europa.eu For further information, please visit: www.eea.europa.eu Human well-being (social and human capital) goal: enhance social equity and fair burden-sharing Ecosystem (natural capital) goal: ensure ecosystem resilience Economy (produced capital) goal: improve resource efficiency GREEN ECONOMY
 goal: enhance social equity and fair burden-sharing Ecosystem (natural capital) goal: ensure ecosystem resilience Economy (produced capital) goal: improve resource efficiency GREEN ECONOMY")
Similar presentations


 information>")


 => first European document dedicated exclusively.>")
 increases, scarcities => prices rise => impact on European economy 20th cent.: 12-fold.>")


