Download presentation
Presentation is loading. Please wait.

1
Study of Downtown Bryan and Economic Compare/Contrast of Bryan- College Station Gabe Rolland Chris Linder

2
Project Overview ► A History Lesson on Bryan and College Station ► Main Street Renovation ► Unique Situation ► Census Data Findings ► Research Valley Business Incentives ► Conclusion

3
History

4
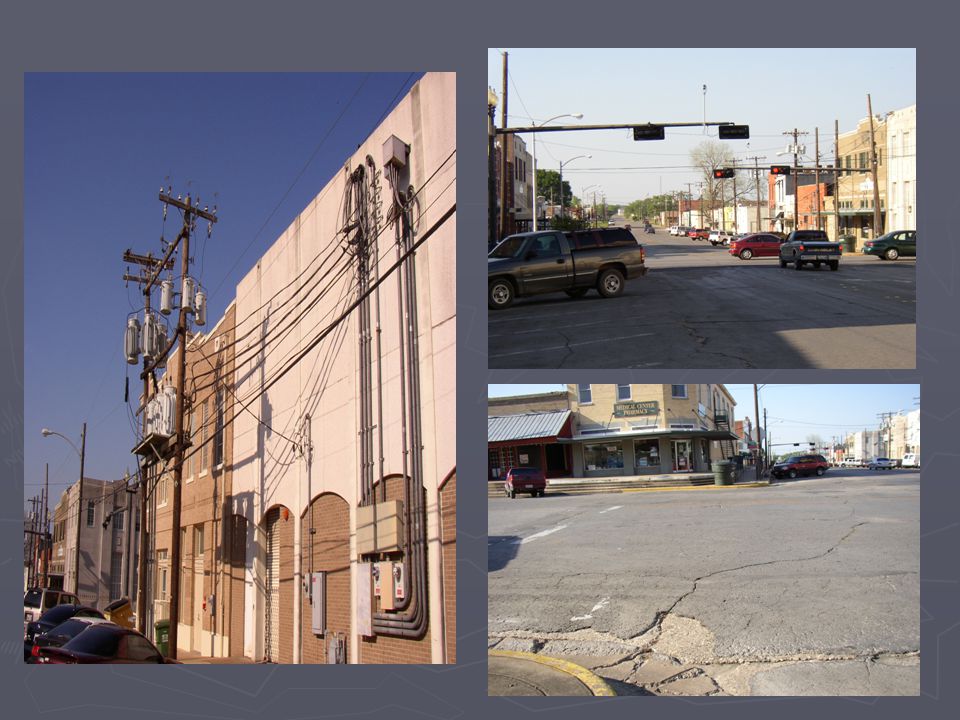
Main Street Renovation

6
Still Needs Work!

8
Much Nicer!!!

9
Unique Situation ► Location TAMU College Station Students Highway Railroad City Center? Minority Distribution

10
Census Data

11
More Census Data

12
People QuickFactsBryan College StationTexas Population, 200065,66067,89020,851,820 Population, percent change, 1990 to 200018.90%28.10%22.80% Persons under 5 years old, percent, 20008.00%4.50%7.80% Persons under 18 years old, percent, 200027.00%14.40%28.20% Persons 65 years old and over, percent, 20009.30%3.60%9.90% Female persons, percent, 200050.20%48.90%50.40% White persons, percent, 2000 (a)64.70%80.50%71.00% Black or African American persons, percent, 2000 (a)17.70%5.40%11.50% American Indian and Alaska Native persons, percent, 2000 (a)0.40%0.30%0.60% Asian persons, percent, 2000 (a)1.70%7.30%2.70% Native Hawaiian and Other Pacific Islander, percent, 2000 (a)0.10% Persons reporting some other race, percent, 2000 (a)13.30%4.50%11.70% Persons reporting two or more races, percent, 20002.20%1.90%2.50% Persons of Hispanic or Latino origin, percent, 2000 (b)27.80%10.00%32.00%
64.70%80.50%71.00% Black or African American persons, percent, 2000 (a)17.70%5.40%11.50% American Indian and Alaska Native persons, percent, 2000 (a)0.40%0.30%0.60% Asian persons, percent, 2000 (a)1.70%7.30%2.70% Native Hawaiian and Other Pacific Islander, percent, 2000 (a)0.10% Persons reporting some other race, percent, 2000 (a)13.30%4.50%11.70% Persons reporting two or more races, percent, %1.90%2.50% Persons of Hispanic or Latino origin, percent, 2000 (b)27.80%10.00%32.00%")
13
Living in same house in 1995 and 2000', pct age 5+, 200040.00%19.60%49.60% Foreign born persons, percent, 200011.10% 13.90% Language other than English spoken at home, pct age 5+, 200025.50%17.30%31.20% High school graduates, percent of persons age 25+, 200072.80%93.80%75.70% Bachelor's degree or higher, pct of persons age 25+, 200026.00%58.10%23.20% Mean travel time to work (minutes), workers age 16+, 200016.814.525.4 Housing units, 200025,70326,0548,157,575 Homeownership rate, 200050.80%30.60%63.80% Median value of owner-occupied housing units, 2000$78,900$119,500$82,500 Households, 200023,75924,6917,393,354 Persons per household, 20002.652.322.74 Median household income, 1999$31,672$21,180$39,927 Per capita money income, 1999$15,770$15,170$19,617 Persons below poverty, percent, 199922.30%37.40%15.40%
, workers age 16+, Housing units, ,70326,0548,157,575 Homeownership rate, %30.60%63.80% Median value of owner-occupied housing units, 2000$78,900$119,500$82,500 Households, ,75924,6917,393,354 Persons per household, Median household income, 1999$31,672$21,180$39,927 Per capita money income, 1999$15,770$15,170$19,617 Persons below poverty, percent, %37.40%15.40%")
14
Business QuickFactsBryan College StationTexas Manufacturers shipments, 1997 ($1000)309,332NA400,008 Wholesale trade sales, 1997 ($1000)278,40579,455323,111,661 Retail sales, 1997 ($1000)657,492653,540182,516,112 Retail sales per capita, 1997$11,245$10,977$9,430 Accommodation and food services sales, 1997 ($1000)53,105117,41122,698,848 Total number of firms, 19974,8243,5121,525,972 Minority-owned firms, percent of total, 199720.00%11.40%23.90% Women-owned firms, percent of total, 199722.50%21.40%25.00% Geography QuickFactsBryan College StationTexas Land area, 2000 (square miles)4340261,797 Persons per square mile, 20001,515.201,686.5079.6 FIPS Code109121597648 Source: U.S. Census Bureau 1999 statistics.

15
Business Incentives ► Property Tax Exemption: “Businesses with new facilities can receive up to 100% abatement for a maximum of 10 years…’’ ► Cash Incentives: “Cash grants provided for creating new jobs and new investments to qualifying companies on a case by case basis…” www.researchvalley.org

16
► Freeport Exemption: “Property tax exemption on business inventory that will be exported within 175 days of entering Texas, goods for assembling, storing, manufacturing, repair, maintenance, processing, or fabrication purposes. Also, on goods that remain in the firms possession the entire time within the state…” ► Utility Incentives: “A favorable utility rate schedule is available to qualifying companies…” www.researchvalley.org

17
► Land Grant or Reduced Price: “Cities will permit a reduction in land price for property or the grant of land in certain business parks. These incentives are determined on a case-by-case basis.” www.researchvalley.org

18
In Conclusion… ► Most development going towards College Station… ► Downtown Bryan facing “spatial Mismatch”. ► B/CS does not fit an ideal city model. ► Rapid Distance Decay facilitated by Spatial Restriction. ► Bryan city center affected by College Station. ► More consolidation needed?

19
Works Cited… ► www.census.gov www.census.gov ► www.researchvalley.org www.researchvalley.org ► Sesquicentennial Edition, Brazos County History: Rich Past – Bright Future.

Similar presentations


 981-4076>")


 and Peter.>")


