Download presentation
Presentation is loading. Please wait.

1
Kansas City BRT Metro Area Express (MAX) TRB BRT Conference, July 21, 2008
 TRB BRT Conference, July 21, 2008")
2
Metropolitan Kansas City Bi-State (Kansas/Missouri) Bi-State (Kansas/Missouri) 1.8 Million Population 1.8 Million Population Kansas City Area Transportation Authority (KCATA): Kansas City Area Transportation Authority (KCATA): Prior to BRT: All Bus Transit System Prior to BRT: All Bus Transit System <50,000 Average Weekday Trips <50,000 Average Weekday Trips
 Bi-State (Kansas/Missouri) 1.8 Million Population 1.8 Million Population Kansas City Area Transportation Authority (KCATA): Kansas City Area Transportation Authority (KCATA): Prior to BRT: All Bus Transit System Prior to BRT: All Bus Transit System <50,000 Average Weekday Trips <50,000 Average Weekday Trips")
3
Southtown Corridor Regional Employment Center Regional Employment Center Civic And Cultural Amenities Civic And Cultural Amenities Commercial and Retail Commercial and Retail Diverse Communities Diverse Communities Slow Transit Service Slow Transit Service Declining Transit Ridership Declining Transit Ridership 2004 Average 3,200 Daily Trips 2004 Average 3,200 Daily Trips River Market Downtown Crown Center Country Club Plaza MidTown /Main St

4
Light Rail Planning 1970’s to 2000 Multiple AA and MIS Studies 1970’s thru 1990’s Multiple AA and MIS Studies 1970’s thru 1990’s Starter Line Prelim. Engineering 1995 to 1997 -$250M Starter Line Prelim. Engineering 1995 to 1997 -$250M Central Business Corridor LRT 1999 to 2001 Central Business Corridor LRT 1999 to 2001 Failed Sales Tax Vote for LRT August 2001 - $793M Failed Sales Tax Vote for LRT August 2001 - $793M No local business or political support No local business or political support BRT if LTR not possible BRT if LTR not possible Satisfied Federal AA Requirement for BRT Satisfied Federal AA Requirement for BRT

5
After years of rail planning Operate like rail Operate like rail Provide rapid transit link between Downtown, Crown Center, and Plaza Provide rapid transit link between Downtown, Crown Center, and Plaza Be Built and Operate: Be Built and Operate: At a fraction of the cost of rail At a fraction of the cost of rail With 80% Federal Funding With 80% Federal Funding NO New Local Taxes ! NO New Local Taxes ! In less than 5 years (Actually 3 years) In less than 5 years (Actually 3 years) Gain business and political support ! Gain business and political support ! BRT is not rail, BUT IT CAN: Bus Rapid Transit
 In less than 5 years (Actually 3 years) Gain business and political support . Gain business and political support . BRT is not rail, BUT IT CAN: Bus Rapid Transit.")
6
BRT Development Timeframe Planning2002 Planning2002 Formal Partnerships Formal Partnerships City and Parks Dept. 2003 City and Parks Dept. 2003 Main St. Community 2003 – Present Main St. Community 2003 – Present Design/Engineering2003/2004 Design/Engineering2003/2004 Vehicles Ordered2004 Vehicles Ordered2004 Construction2004-2005 Construction2004-2005 OperationalJuly 2005 OperationalJuly 2005

7
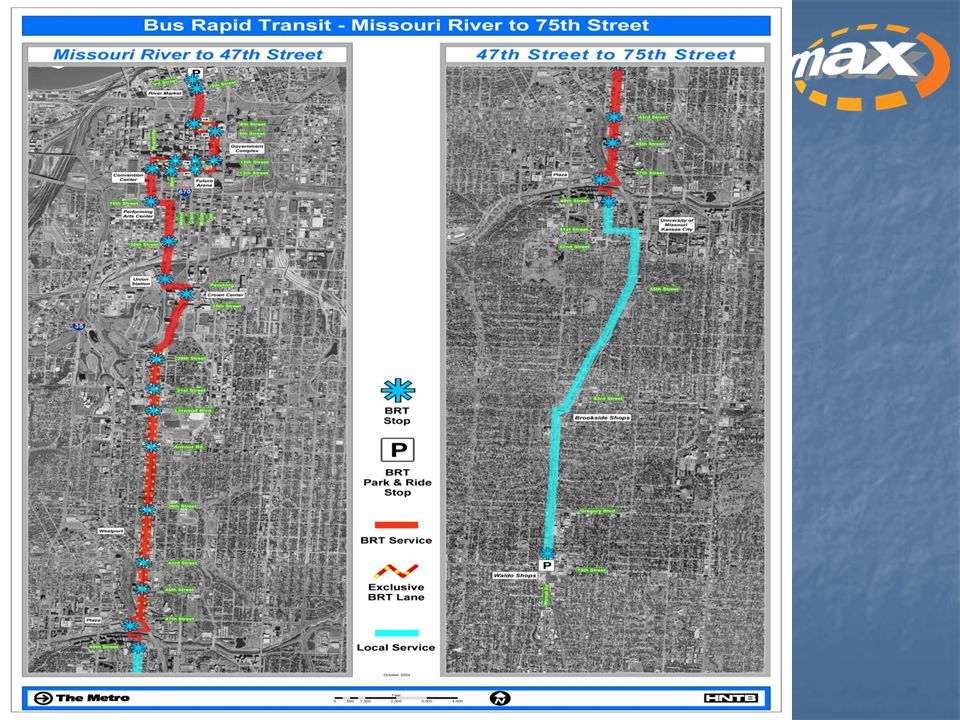
Profile of KCATA BRT Arterial Street Running BRT (6 Miles) Arterial Street Running BRT (6 Miles) Simple but Substantial Stations w/Enhanced Amenities Simple but Substantial Stations w/Enhanced Amenities Real-Time Information – All Stations Real-Time Information – All Stations Exclusive Transit Lanes Exclusive Transit Lanes Signal Priority – 31 Intersections Signal Priority – 31 Intersections Identity / Branding – MAX Identity / Branding – MAX 9 Minute Peak Hour Headways 9 Minute Peak Hour Headways Travel Time Reduced by 20%+ Travel Time Reduced by 20%+
 Arterial Street Running BRT (6 Miles) Simple but Substantial Stations w/Enhanced Amenities Simple but Substantial Stations w/Enhanced Amenities Real-Time Information – All Stations Real-Time Information – All Stations Exclusive Transit Lanes Exclusive Transit Lanes Signal Priority – 31 Intersections Signal Priority – 31 Intersections Identity / Branding – MAX Identity / Branding – MAX 9 Minute Peak Hour Headways 9 Minute Peak Hour Headways Travel Time Reduced by 20%+ Travel Time Reduced by 20%+")
9
MAX Vehicles / BRT Specific

10
Vehicle Objectives Distinctive BRT Design Distinctive BRT Design Identifiable as BRT from Shape & Graphics Identifiable as BRT from Shape & Graphics Identifiable as BRT Day and Night Identifiable as BRT Day and Night Stylish / High Tech. Look Stylish / High Tech. Look Incorporate New Technology Incorporate New Technology Affordable Affordable Maintainable without major facility changes Maintainable without major facility changes 2004 Unit Price: $323,000 2004 Unit Price: $323,000

11
MAX Vehicles Fleet of 13 Vehicles Fleet of 13 Vehicles 42’ Low Floor Vehicle 42’ Low Floor Vehicle BRT Style BRT Style Unique MAX Paint Scheme Unique MAX Paint Scheme Wider Doors & Windows Wider Doors & Windows Improve Knee-Hip Room Improve Knee-Hip Room 39 Seats 39 Seats GPS, MDT, TSP GPS, MDT, TSP Bike Racks Bike Racks

12
MAX Street Operations 7 days a week 7 days a week 4:30 am to midnight 4:30 am to midnight 9-minute headways am & pm peak 9-minute headways am & pm peak 15 minutes midday, Saturday, events 15 minutes midday, Saturday, events 30 minutes nights and Sundays 30 minutes nights and Sundays Plaza to Downtown: 18 minutes Plaza to Downtown: 18 minutes Previously 24 minutes Previously 24 minutes Local bus service paired with MAX in corridor Local bus service paired with MAX in corridor

13
MAX ‘Bus Only’ Lanes Street Capacity Available Street Capacity Available Peak Hour ‘Bus Only’ Lanes Peak Hour ‘Bus Only’ Lanes Full-Time ‘Bus Only’ Lane Downtown Full-Time ‘Bus Only’ Lane Downtown ‘Bus Only’ Lanes 52% of MAX ‘Bus Only’ Lanes 52% of MAX Meets FTA “Fixed Guideway” Requirement (for New Starts) Meets FTA “Fixed Guideway” Requirement (for New Starts)
 Meets FTA Fixed Guideway Requirement (for New Starts)")
15
ITS Technology Radio/GPS System (Separately funded) Radio/GPS System (Separately funded) Traffic Signal Priority (TSP) Traffic Signal Priority (TSP) Upgraded controllers and interconnect (fiber) Upgraded controllers and interconnect (fiber) New BRT signal timings New BRT signal timings TSP When >1 min. late TSP When >1 min. late No Operator Interaction No Operator Interaction Goal: 60% to 70% TSP granted Goal: 60% to 70% TSP granted ATA MDT & IVLU control and activate on- board emitter

16
Station Design

17
MAX Station Design Goals Reposition Transit Image Reposition Transit Image Clean, Sleek and Modern Clean, Sleek and Modern Sense of Permanence Sense of Permanence Integrate New Technology Integrate New Technology Branding/BRT Identity Branding/BRT Identity Standard Elements (Site adapted kit of parts) Standard Elements (Site adapted kit of parts) Station Prototype Station Prototype
 Standard Elements (Site adapted kit of parts) Station Prototype Station Prototype")
18
MAX Station and Amenities Trash Receptacle MAX Shelter MAX Marker Sidewalk/Streetscape Improvements Landscaping/Public Art at selected locations where ROW available Named Stations for Community / Neighborhoods Named Stations for Community / Neighborhoods Attractive, Well-Lighted Station, Unique to MAX Attractive, Well-Lighted Station, Unique to MAX Pedestrian / Sidewalk / Streetscape Improvements Pedestrian / Sidewalk / Streetscape Improvements Real-Time Bus Arrival Signage and Announcements Real-Time Bus Arrival Signage and Announcements

19
MAX Station Shelter and Marker

20
MAX Station Shelter and Marker

21
ITS Technology Real-Time Arrival Information Real-Time Arrival Information All Stations All Stations Traffic Signal Priority Traffic Signal Priority 31 Intersections 31 Intersections Automated Announcements Automated Announcements Audio and Visual (Sign) Audio and Visual (Sign) On-board and external On-board and external
 Audio and Visual (Sign) On-board and external On-board and external")
22
Station Information Neighborhood and Transit

23
MAX Capital Cost Capital Cost - $21-Million 80% Federal Funding 20% Local Funding Budget Breakdown (In Millions) $ 2.9 Planning, Design & Engineering $ 4.3 Vehicles and Inspections $ 2.3 Street Paving Construction $ 1.8 Traffic Signal and Signal Priority $ 8.5 Stop Construction / Installation $ 0.7 Admin, Easements, Utility & Legal
 $ 2.9 Planning, Design & Engineering $ 4.3 Vehicles and Inspections $ 2.3 Street Paving Construction $ 1.8 Traffic Signal and Signal Priority $ 8.5 Stop Construction / Installation $ 0.7 Admin, Easements, Utility & Legal")
24
MAX Bus Rapid Transit MAX Opened July 2005 MAX Opened July 2005 Ridership Up 50%+ Ridership Up 50%+ Pre-MAX: 3,200/day Pre-MAX: 3,200/day Current: > 6,000/day Current: > 6,000/day High Level of Public Acceptance and Satisfaction High Level of Public Acceptance and Satisfaction

25
Keys to MAX Success Early Cooperative Partnerships Early Cooperative Partnerships City, Community, MainCor City, Community, MainCor Formal ATA / City Agreement Formal ATA / City Agreement Early Prototype Station Early Prototype Station Avoiding ROW Acquisition Avoiding ROW Acquisition Stations on Far Side of Intersections Stations on Far Side of Intersections Funded with Existing Resources Funded with Existing Resources MAX Branding and Marketing MAX Branding and Marketing

26
What would we do differently? More Buses – Small Fleet Challenges More Buses – Small Fleet Challenges Fewer Station Compromises Fewer Station Compromises More emphasis on far side stations More emphasis on far side stations More Lane Dedication (More Hours) More Lane Dedication (More Hours) No added stations / Maintain spacing No added stations / Maintain spacing Signal Priority Signal Priority Negotiate more transit priority Negotiate more transit priority Add intersections Add intersections Expanded sidewalk improvements Expanded sidewalk improvements More emphasis on ride quality and pavement improvements More emphasis on ride quality and pavement improvements
 More Lane Dedication (More Hours) No added stations / Maintain spacing No added stations / Maintain spacing Signal Priority Signal Priority Negotiate more transit priority Negotiate more transit priority Add intersections Add intersections Expanded sidewalk improvements Expanded sidewalk improvements More emphasis on ride quality and pavement improvements More emphasis on ride quality and pavement improvements.")
27
Expanding MAX FTA Small Starts Program FTA Small Starts Program State Ave. Metcalf / College. Shawnee Mission Pkway Troost North Oak Liberty / KCI. Linwood /Highway 40 Independence Ave. Main/Wornall - MAX KCI Downtown.

28
Troost Corridor Local Transit Service Only Local Transit Service Only 13+ Miles 13+ Miles Daily Transit Ridership 7,500+ Daily Transit Ridership 7,500+ Frequent, Closely Spaced Stops Frequent, Closely Spaced Stops Very Slow Service in Urban Core Very Slow Service in Urban Core Existing Route # 25 Troost Local Bus Service

29
Troost BRT Implementation Schedule 2006 – Planning / Update AA 2006 – Planning / Update AA Sept. 2006 – Small Starts Funding Submission to FTA Sept. 2006 – Small Starts Funding Submission to FTA Summer 2007 – Complete PE & Project Development Summer 2007 – Complete PE & Project Development 2008 / 2009 – Final Design / Construction 2008 / 2009 – Final Design / Construction Open – Late 2009 / Early 2010 Open – Late 2009 / Early 2010

30
Troost BRT – Very Small Start Corridor Based Project (10 Miles – Urban Arterial) Corridor Based Project (10 Miles – Urban Arterial) Existing Ridership ~ 7,500 Existing Ridership ~ 7,500 To > 9000 (20% Increase) To > 9000 (20% Increase) Emphasize MAX Brand Emphasize MAX Brand < 10 Min. Peak Headways < 10 Min. Peak Headways 20%+ Time Savings 20%+ Time Savings

31
Troost BRT – Very Small Start Substantial Branded Stations Substantial Branded Stations 44 Stations (2 per Intersection) 44 Stations (2 per Intersection) 2 Park and Rides + Terminus 2 Park and Rides + Terminus Signal Priority @ 34 Intersections Signal Priority @ 34 Intersections Low Floor BRT Vehicles (14) Low Floor BRT Vehicles (14) Capital Cost < $3 M per Mile Capital Cost < $3 M per Mile
 44 Stations (2 per Intersection) 2 Park and Rides + Terminus 2 Park and Rides + Terminus Signal 34 Intersections Signal 34 Intersections Low Floor BRT Vehicles (14) Low Floor BRT Vehicles (14) Capital Cost < $3 M per Mile Capital Cost < $3 M per Mile")
32
Troost MAX Station Design Unique to Troost MAX Unique to Troost MAX Recognizable as MAX Brand Recognizable as MAX Brand Community Input on Station Naming Community Input on Station Naming More Amenities & Waiting Areas More Amenities & Waiting Areas Multi-Directional Weather Protection Multi-Directional Weather Protection More Lighting & Pedestrian Improvements More Lighting & Pedestrian Improvements Incorporate “Green Elements” Incorporate “Green Elements”

33
Troost MAX Station Design

34
Branding MAX on Troost Maintain MAX Maintain MAX Route Name Route Name Colors Colors Vehicle Displays Vehicle Displays Information Displays Information Displays

35
MAX Vehicles -Uniform Fleet with Colored Headsigns - Introduction of Hybrids

36
Troost MAX Capital Cost Capital Cost - $30.7-Million 80% Federal Funding – VERY SMALL START 20% Local Funding Budget Breakdown (In Millions) $ 3.2 Planning, Design & Engineering $ 5.9 BRT Vehicles (Includes 3 Hybrids) $ 0.4Support Facilities (Maintenance) $ 3.5 Paving, Streetscape, Sidewalk $ 2.5 Systems (Signals, Signs, TVM) $12.6 Stations & Park-and-Rides $ 1.3 Admin, Easements, Utility & Legal
 $ 3.2 Planning, Design & Engineering $ 5.9 BRT Vehicles (Includes 3 Hybrids) $ 0.4Support Facilities (Maintenance) $ 3.5 Paving, Streetscape, Sidewalk $ 2.5 Systems (Signals, Signs, TVM) $12.6 Stations & Park-and-Rides $ 1.3 Admin, Easements, Utility & Legal")
37
QUESTIONS?

Similar presentations


 ITS Washington November 12, 2008.>")


