Download presentation
Presentation is loading. Please wait.

1
Using Visual Patterns to Facilitate Learning

3
Developed in 1988 by Dr. David Hyerle. A common visual language for learning.A common visual language for learning. They have a consistent design and are used at all grade levels. Non linguistic representation of 8 thinking skills: Non linguistic representation of 8 thinking skills: defining describing sequencing classifying comparing and contrasting analogies recognizing part whole relationships With consistent use, the brain develops a pattern that connects the process to a specific Thinking Map. 8 Maps that are used by teachers and students for reading comprehension, writing process, problem solving and thinking skills

4
Consistent. The maps are a visual for thinking skills Flexible. The learner—and the content determines the complexity of the ma Developmental. Based on primitive graphics Integrative. 1 topic + multiple perspectives= different maps. Reflective. Think about your thinking. Maps become life-long tools.

5
Why use Thinking Maps?

6
Thinking Process: Defining in Context Key Question: How are you defining this thing or idea? Key Words and Phrases: List, define, tell everything you know, brainstorm, identify, relate prior knowledge, describe, explore the meaning Common Uses: Brainstorm for writing, used as a starting point during the prewriting stage, defining words, identifying audience and author’s point of view

8
Thinking Process: Describing Qualities; Characterization Key Question: How are you describing this thing? What adjectives best describe it? Key Words and Phrases: Describe, use vivid language, describe feelings, observe using the five senses

10
Thinking Process: Comparing and Contrasting Key Question: What are the similar and different qualities of these things? Key Words and Phrases: Compare/contrast, discuss similarities and differences, prioritize essential characteristics, distinguish between, differentiate

12
A bubble map show helps the student use adjectives. Evidence is written outside the bubble.

13
Thinking Process: Classifying Key Question: What are the main ideas, supporting ideas, and details in information? Key Words and Phrases: Classify, sort, group, categorize, give sufficient and related details

16
Thinking Process: Part to whole relationship Key Question: What are the parts and subparts of this whole physical object? Key Words and Phrases: Part of, take apart, show structure It is for parts only, for “types” of things, a Tree Map should be used.

19
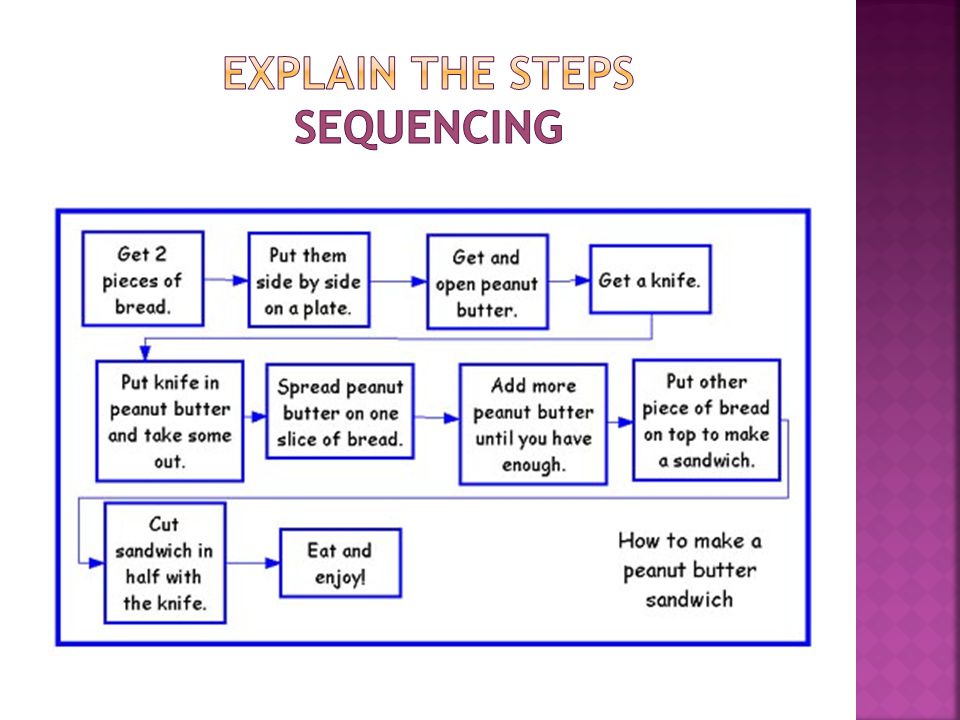
Thinking Process: Sequencing Key Question: What happened? What is the sequence of events? What are the sub-stages? Key Words and Phrases: Sequence, put in order, order, recount, retell, what happens next, cycles, patterns, describe processes, describe change, solve multi-step problems

21
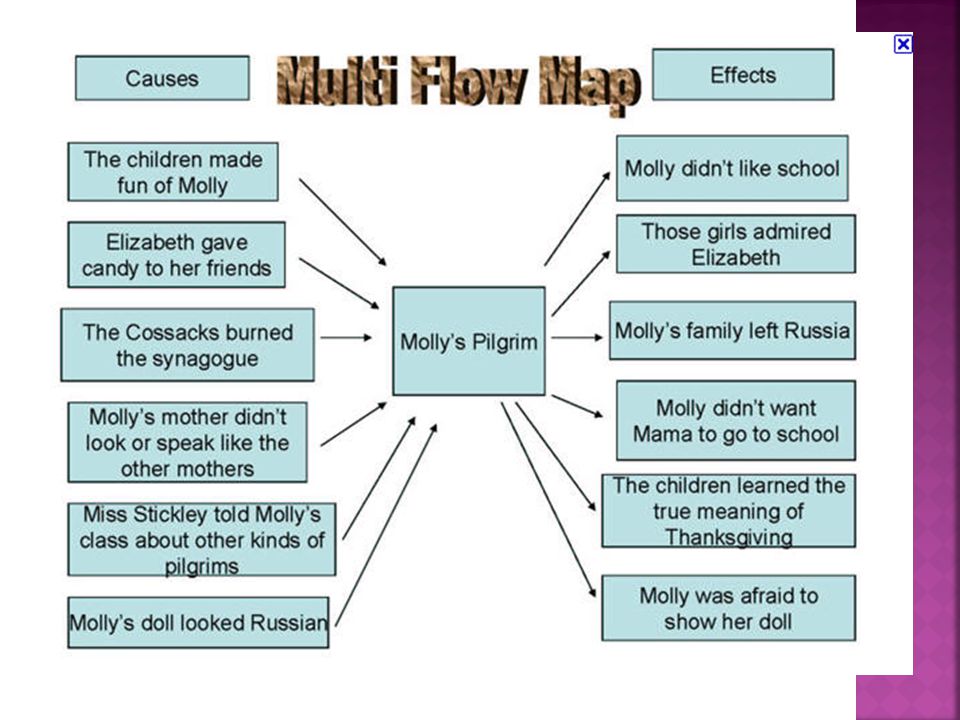
Thinking Process: Cause and Effect; Problem-Solution Key Question: What are the causes and effects of this event? What might happen next? Key Words and Phrases: Causes and effects, discuss consequences, what would happen if, predict, describe change, identify motives, discuss strategies Common Uses: Used to show and analyze cause and effect relationships. It can also be used with only part of the map showing, such as predicting outcomes.

22
What caused you to do it?

24
Thinking Process: analogies Key Question: What is the analogy being used? Key Words and Phrases: Identify the relationship, guess the rule, interpret symbols Relating Factor: How are they connected? Identifies similarities between relationships. The relating factor answers “How are they related?” The Bridge Map should be able to be read as a complete sentence.

27
Directions: Directions: Compare and contrast Thinking Maps with other graphic organizers. I ask myself, “what map helps me compare and contrast?”

29
What is the Frame of Reference? The Frame of Reference can be used with any of the eight maps. It provides an area for students to synthesis information think more deeply support their reasoning (evidence)
.")
30
Elaborating with the Extras (The E’s)Interpreting Information (The I’s) Include your own personal experiences. What is the importance of this information? Use supporting examples from the text. What inferences can be made? Incorporate evidence from text/world.What influences affect this information? What historical/literary events support your ideas? Include further explanation on the subject. Elaborate on your thinking and reasoning. What expert “opinions” can you find as support? Include excitement or personal feelings about the topic.

31
Assignment: Think about your favorite food. Write a paragraph explaining why you like it.

33
Examples of each map grades K-6 http://fdlrs.brevard.k12.fl.us/ThinkingMaps/default.html Newsletters devoted to each Thinking Map http://www.kcclc.org/thinkingmaps2?print-friendly=true Chippewa Valley ELA Website http://chippewavalleyela.pbworks.com

Similar presentations