Download presentation
Presentation is loading. Please wait.

1
fisheries

2
efficient harvests biology biology economic economic

3
biological dimension Schaefer model (1957) Schaefer model (1957) abstracting from water temp / quality, age structure, etc. abstracting from water temp / quality, age structure, etc. relationship btw. growth of popn and size of popn relationship btw. growth of popn and size of popn

4
growth as a function of stock

5
carrying capacity vs. minimum viable popn : carrying capacity / natural equilibrium : carrying capacity / natural equilibrium stable, movements away set forces in motion back towards it : minimum viable popn : minimum viable popn below growth is negative unstable to right, growth to natural equilibrium to right, growth to natural equilibrium to left, decline to extinction to left, decline to extinction

6
“sustainable yield” catch growth rate each period, catch and population can be maintained forever catch growth rate each period, catch and population can be maintained forever S*: “maximum sustainable yield” (MSY) S*: “maximum sustainable yield” (MSY) –yields maximum growth –largest catch that can be perpetually sustained
 S*: maximum sustainable yield (MSY) –yields maximum growth –largest catch that can be perpetually sustained")
7
economics: efficient yield is MSY synonymous with efficiency? (no) is MSY synonymous with efficiency? (no) for efficient solution: maximize net benefits from use of resource for efficient solution: maximize net benefits from use of resource need to include costs and benefits of harvest, not just quantity need to include costs and benefits of harvest, not just quantity examine static efficient sustainable yield (largest annual net benefit) examine static efficient sustainable yield (largest annual net benefit)
 is MSY synonymous with efficiency. (no) for efficient solution: maximize net benefits from use of resource for efficient solution: maximize net benefits from use of resource need to include costs and benefits of harvest, not just quantity need to include costs and benefits of harvest, not just quantity examine static efficient sustainable yield (largest annual net benefit) examine static efficient sustainable yield (largest annual net benefit).")
8
3 assumptions price of fish constant price of fish constant MC fishing effort constant MC fishing effort constant fish caught per unit effort is proportional to size of population (smaller popn, fewer fish caught per unit effort) fish caught per unit effort is proportional to size of population (smaller popn, fewer fish caught per unit effort)
 fish caught per unit effort is proportional to size of population (smaller popn, fewer fish caught per unit effort)")
9
efficient sustainable yield

10
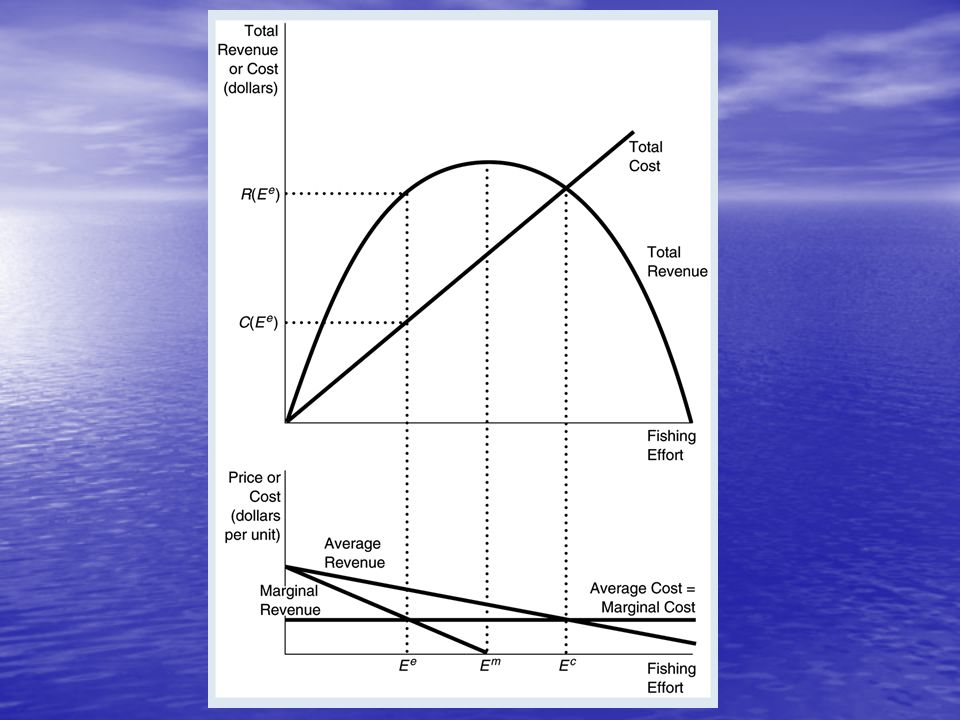
efficient fishing effort TR follows Schaefer model since price constant TR follows Schaefer model since price constant TC linear since MC effort constant TC linear since MC effort constant Em: further effort reduces sustainable catch and revenue for all years (MSY) Em: further effort reduces sustainable catch and revenue for all years (MSY) net benefit: vertical distance btw B & C net benefit: vertical distance btw B & C Ee: efficient effort, where net benefits maximized Ee: efficient effort, where net benefits maximized MB (slope of TB) = MC (slope of constant TC curve)
 Em: further effort reduces sustainable catch and revenue for all years (MSY) net benefit: vertical distance btw B & C net benefit: vertical distance btw B & C Ee: efficient effort, where net benefits maximized Ee: efficient effort, where net benefits maximized MB (slope of TB) = MC (slope of constant TC curve)")
12
efficient fishing effort effort > Ee inefficient, since additional cost exceeds value of fish obtained effort > Ee inefficient, since additional cost exceeds value of fish obtained MSY not efficient unless MC effort = 0 (why?) MSY not efficient unless MC effort = 0 (why?) efficient level of effort LESS than MSY efficient level of effort LESS than MSY efficiency implies LESS harvesting and LARGER population efficiency implies LESS harvesting and LARGER population
 MSY not efficient unless MC effort = 0 (why ) efficient level of effort LESS than MSY efficient level of effort LESS than MSY efficiency implies LESS harvesting and LARGER population efficiency implies LESS harvesting and LARGER population")
13
efficient vs. market allocation with well-defined property rights, sole owner of fishery would max profit by increasing effort until MR=MC with well-defined property rights, sole owner of fishery would max profit by increasing effort until MR=MC –harvest at Ee (efficient) but…fisheries typically OPEN ACCESS but…fisheries typically OPEN ACCESS
 but…fisheries typically OPEN ACCESS but…fisheries typically OPEN ACCESS.")
14
open access solution sole owner of fishery chooses to not expend > Ee because to do so reduces profit of fishery (personal loss) sole owner of fishery chooses to not expend > Ee because to do so reduces profit of fishery (personal loss) if unrestricted access, decision to expend > Ee reduces total profit, but not to individual fisher if unrestricted access, decision to expend > Ee reduces total profit, but not to individual fisher in open access, Ec effort (net benefits zero) in open access, Ec effort (net benefits zero)
 sole owner of fishery chooses to not expend > Ee because to do so reduces profit of fishery (personal loss) if unrestricted access, decision to expend > Ee reduces total profit, but not to individual fisher if unrestricted access, decision to expend > Ee reduces total profit, but not to individual fisher in open access, Ec effort (net benefits zero) in open access, Ec effort (net benefits zero)")
16
fishery prisoner’s dilemma Fisher B Fisher A Fish more! Fish less Fish more! 2,24,1 Fish less 1,43,3 Note: Payoffs in thousands $ (A, B)
.")
17
too much effort! policy responses increase MC– require fishing farther from shore, use smaller nets, boats, or motors increase MC– require fishing farther from shore, use smaller nets, boats, or motors –but artificially increasing cost inefficient total allowable catch – restrictions on effort or size of catch total allowable catch – restrictions on effort or size of catch –monitoring, enforcement difficult, also creates race to catch individual transferable quotas –quotas allocated, then trade individual transferable quotas –quotas allocated, then trade –no race, allows most efficient fishers to buy rights from inefficient fishers

18
Sample problem Costs fisher $20 to fish salmon Costs fisher $20 to fish salmon Salmon sells for $10 Salmon sells for $10 Harvest rate given X fishers is S = 30X-2 Harvest rate given X fishers is S = 30X-2X 2 How many people will go fishing, how many salmon will be caught, and what are total profits under How many people will go fishing, how many salmon will be caught, and what are total profits under –Open access –Limited entry (how many fishers should be allowed to maximize profit?)
")
Similar presentations


 : Natural Resource Economics : An Introduction, Chapter 12, McGraw Hill.>")


 – Based on the logistic equation:>")