Download presentation
Presentation is loading. Please wait.

1
Homework #8 Due Thursday Quiz #4 Thursday Nov. 17 th Homework #9 Thursday Nov. 17 th Group Outline due Thursday Nov. 17th Exam #4 Dec. 1st

2
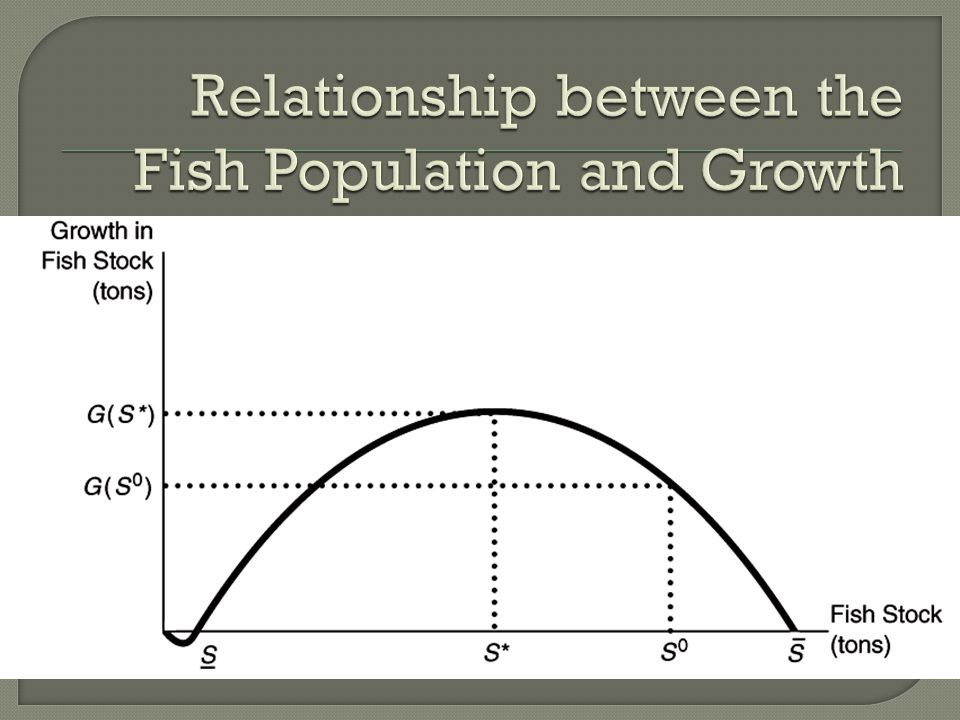
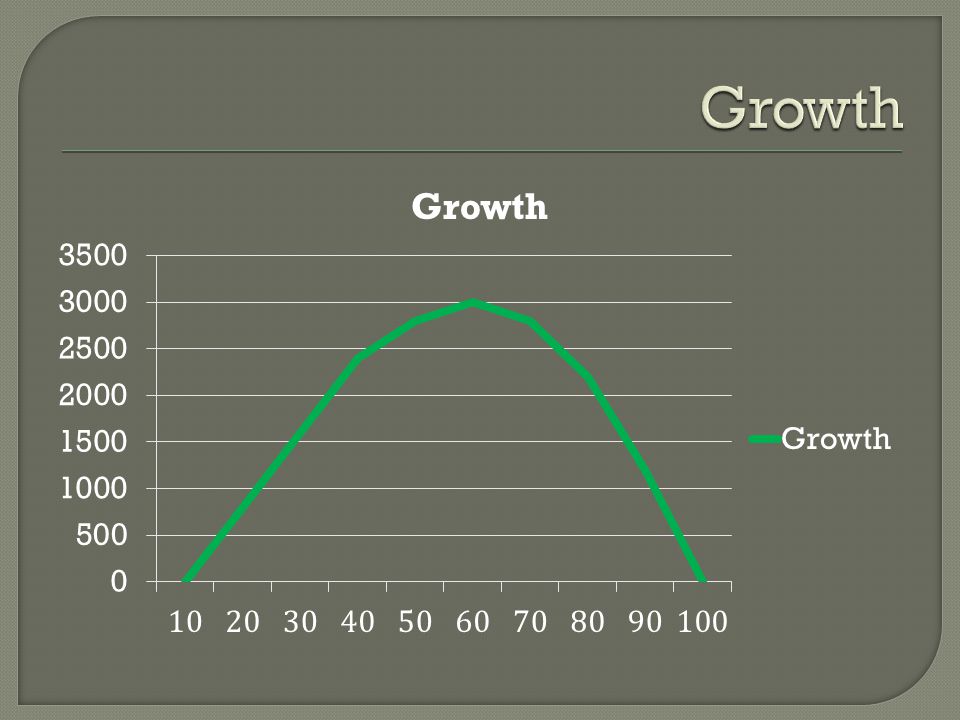
What is the difference between a stable and an unstable equilibrium in the population of a fishery? Use a graph to support your answer. Where does the maximum sustained yield occur in your graph?

3
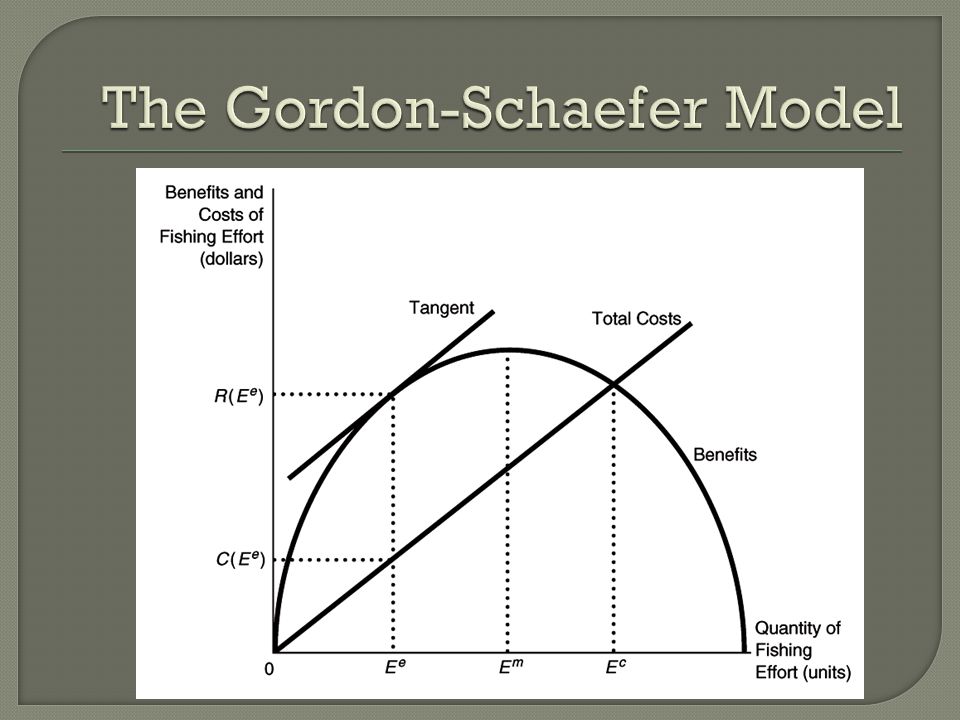
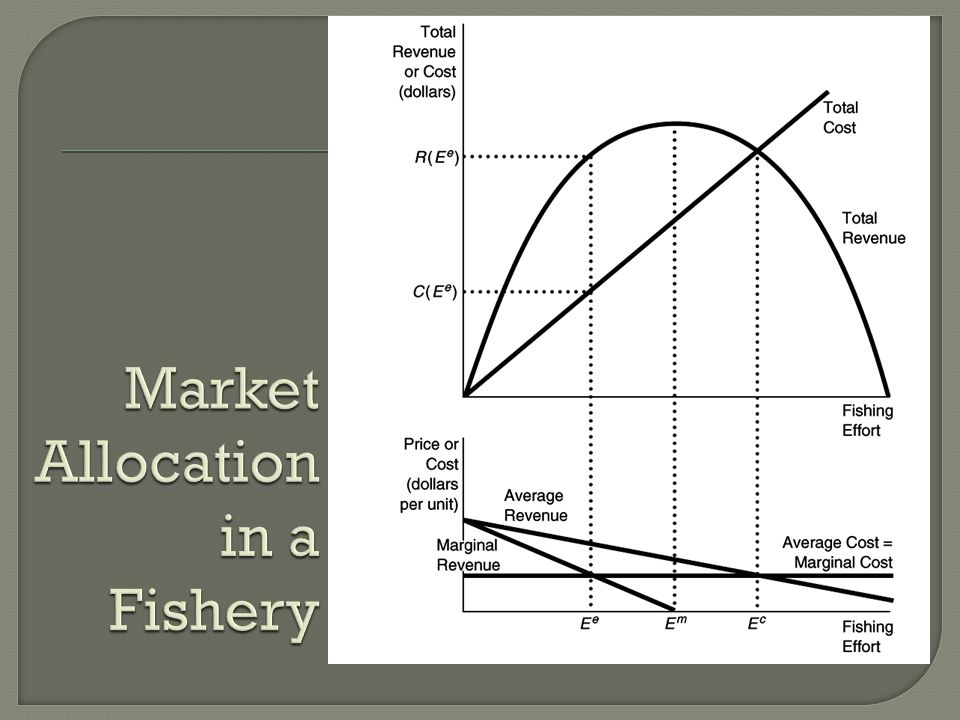
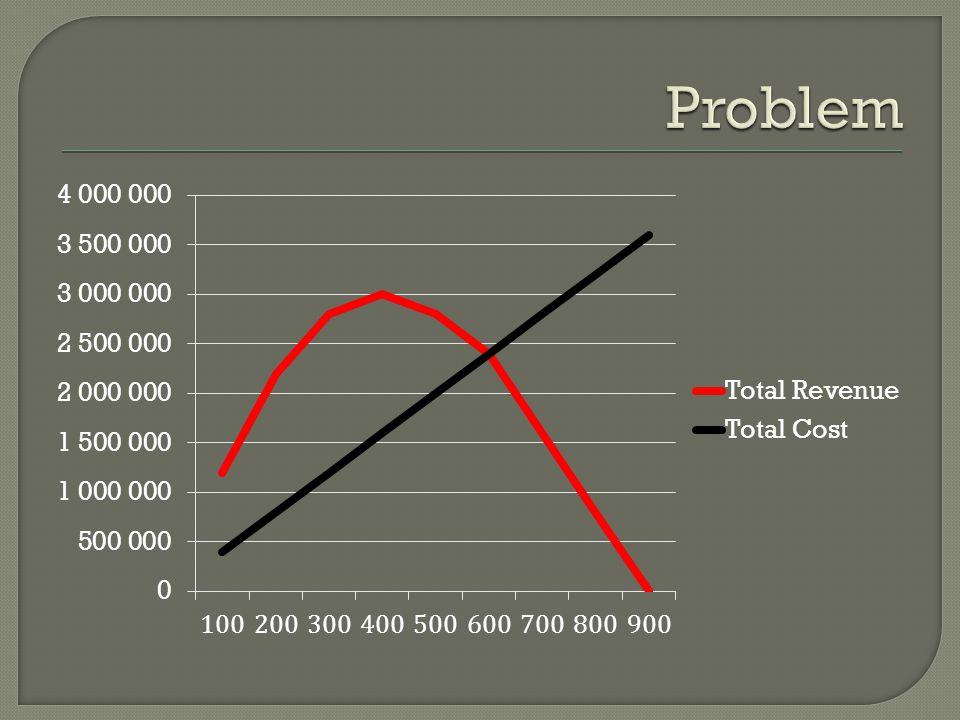
Use a graph with a total cost curve and a total revenue curve for a fishery to show the difference between the economically optimal harvest, the maximum sustained yield, and the open-access equilibrium.

4
What is the typical relationship between the economic optimum (E E ), maximum sustained yield (E M ), and the open-access equilibrium (E O )?
, maximum sustained yield (E M ), and the open-access equilibrium (E O )")
8
If the price of fish increases, total revenue will increase, shifting the open-access equilibrium higher and the stock of fish lower. As stocks deplete, we move closer to the minimum viable population. Lower stocks imply more scarcity and higher prices.

9
Private Ownership Raise the Real Cost of Fishing NB =0 Permits or Taxes Welfare transfer to government ITQs (Individual Transferable Quotas ) Welfare depends on initial winners and losers
 Welfare depends on initial winners and losers")
11
ITQs Allocation Auction Grandfathering Lottery Efficient ITQ Market Quota entitles holder to catch a specified amount of the total authorized catch Catch authorized is equal to the efficient catch for the fishery Quotas should be freely transferable among fishermen

12
Stock102030405060708090100 Growt h 080016002400280030002800220012000 Boats100200300400500600700800900 Total Product 12002200280030002800240016008000 Find the MSY, natural equilibriums, and identify the stable and unstable equilibriums Price = $1,000/ton Cost per Boat is $4,000

15
A natural state with no fishing industry A fishing industry obtaining the MSY from the fishery A fishing industry operating under an efficient management plan, with economically optimal returns A fishing industry characterized by open access.

Similar presentations


? Recognizing comparative advantage Benefits and costs.>")


