Download presentation
Presentation is loading. Please wait.

1
FDOT’s Web Interface Presented by: Paul Herring Florida DOT, Estimates Office paul.herring@dot.state.fl.us

3
Outline What is FDOT’s Web Interface? Why did we need an Interface? Benefits of the Interface Steps in loading data User Roles Demonstration

4
A simple application that allows designers to:A simple application that allows designers to: –easily input pay items and quantities into the PES Oracle database –generate a variety of reports …without using TRNS*PORT PES software!!! What is FDOT’s Web Interface?

5
Why did FDOT need an Interface? Accessibility Confidentiality Large number of users Training

6
Why did FDOT need an Interface? Accessibility for external users had to be considered.Accessibility for external users had to be considered. –Web Interface is an internet application, accessed through FDOT website. –Accessible to users with proper authority and adequate roles.

7
Why did FDOT need an Interface? ConfidentialityConfidentiality only Estimates staff are allowed access to estimates. –For legal reasons, only Estimates staff are allowed access to estimates. –PES/CES software would not provide this security.

8
Why did FDOT need an Interface? Large Number of UsersLarge Number of Users – –Approximately 800 consultant designers working outside FDOT. –High turnover rate for external users. –Training would be an ongoing issue.

9
Why did FDOT need an Interface? TrainingTraining –PES would have required an estimated 12 – 16 hours of hands-on training: –Most of FDOT’s training facilities accommodate a maximum of 12-14 students. –For 800 students, approx. 125 days of training would be required statewide.

10
Benefits of FDOT Web Interface Training time reduced:Training time reduced: –Auditorium-style training was accomplished in 2 hour sessions, with up to 150 students each; –Estimated $68,000 savings; –Material cost was reduced considerably. SecuritySecurity Intuitive, user-friendlyIntuitive, user-friendly –Windows features – buttons, check boxes, drop-down lists, etc.

11
Our users LIKE IT !!!! Benefits of FDOT Web Interface User problems are virtually non-existent!!

12
7 Simple Steps in Loading Data: Step 1 - Transfer Project Data from FM (Financial Management System) to TP PES.Step 1 - Transfer Project Data from FM (Financial Management System) to TP PES. Step 2 - Set Control/Pass control to Designer.Step 2 - Set Control/Pass control to Designer. Step 3 - Designer locates project in project menu in Designer Interface.Step 3 - Designer locates project in project menu in Designer Interface.

13
Step 4 – Customizes categories to project.Step 4 – Customizes categories to project. Step 5 – Loads limited category header information.*Step 5 – Loads limited category header information.* 7 Simple Steps in Loading Data:

14
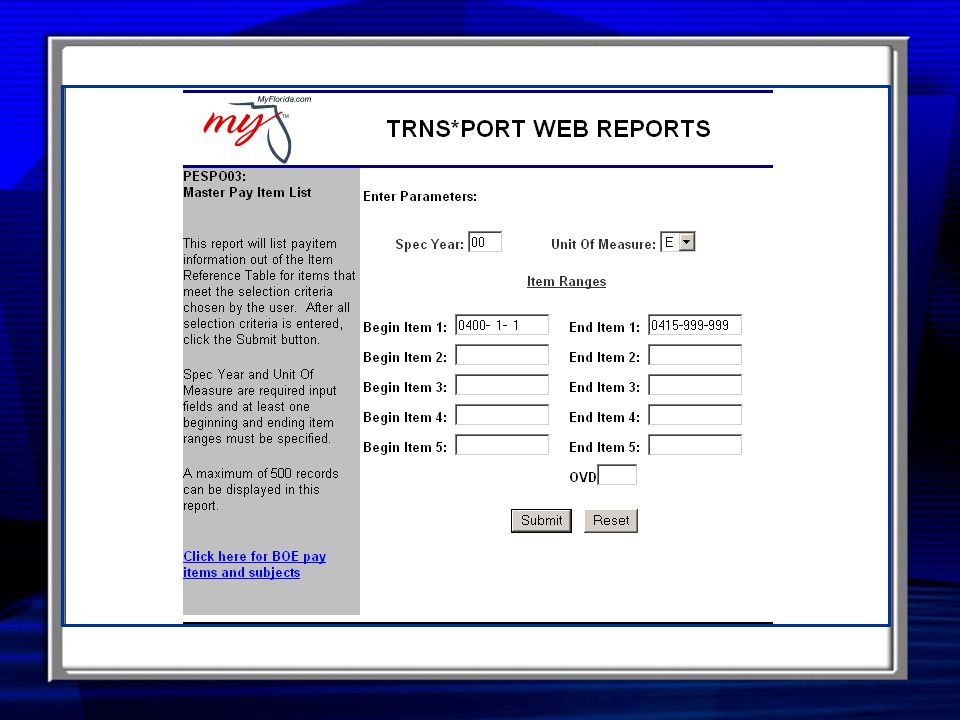
Step 6Step 6 – Load Items & Quantities: –Validation is made with Master Pay Item List on items the designer is attempting to load. –Comparison is made with the Letting Date and the date an item is to be valid or obsolete. –Immediate feedback if problem with item above. 7 Simple Steps in Loading Data:

15
Step 7 – Summary of Items & Quantities, 1 step process, then options to:Step 7 – Summary of Items & Quantities, 1 step process, then options to: –View on Screen –Save to File –Transfer to CADD File 7 Simple Steps in Loading Data:

16
Access to Web Interface Controlled by District and Central Coordinators Options available are directly related to a user’s function or role.

17
User Roles Florida has approx. 65 roles for PES and CES For today’s demo, we will look at – Designer, Public and Estimator roles

18
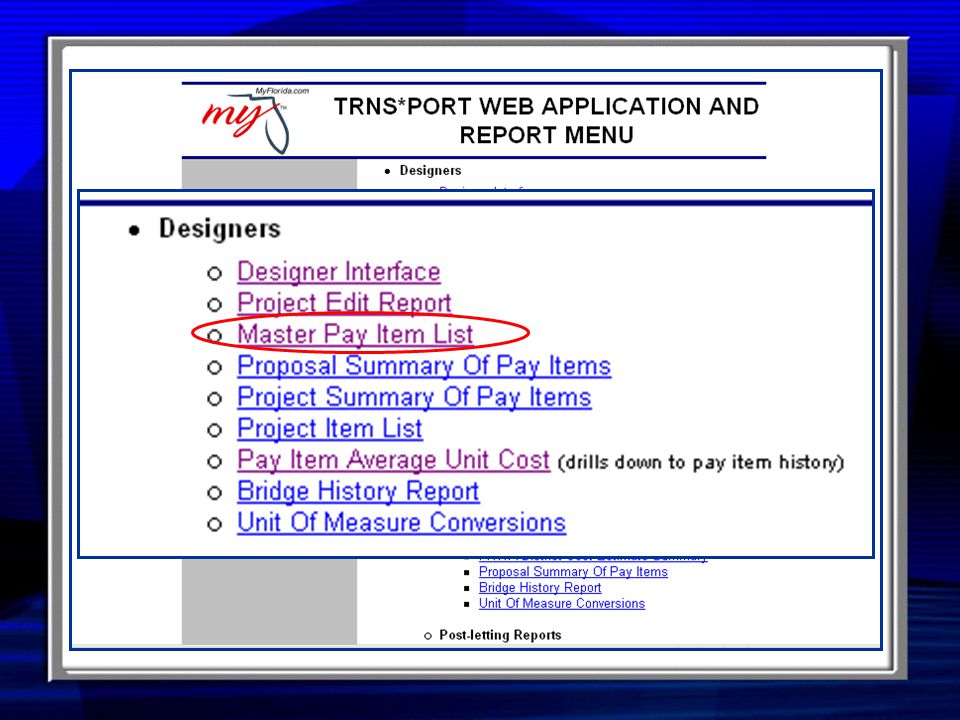
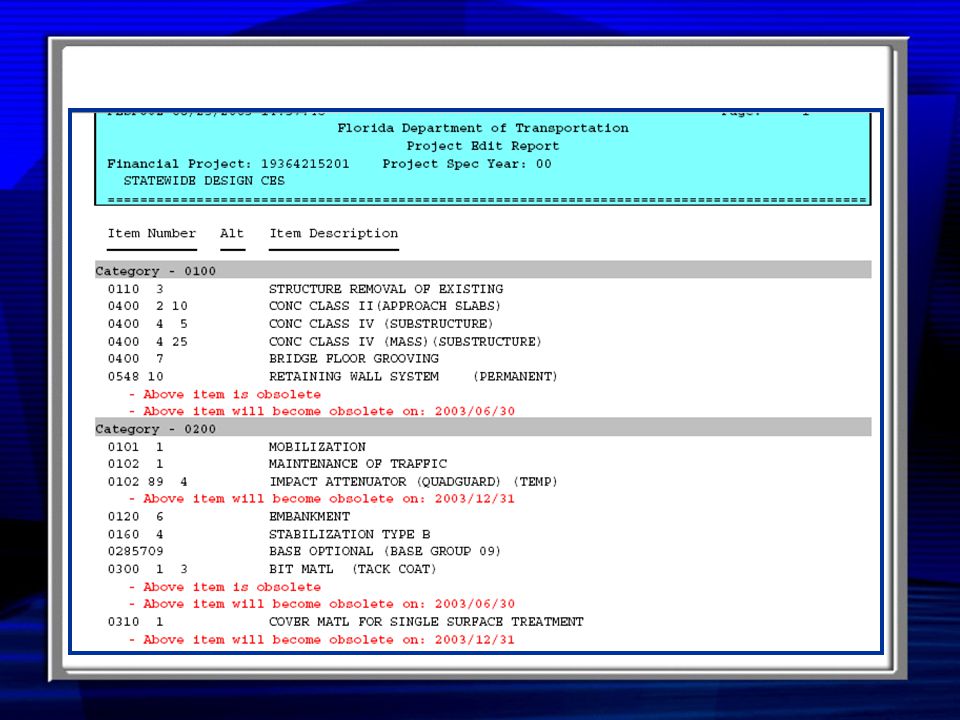
User Roles DesignerDesigner –Designer Interface –Project Edit Report –Master Pay Item List –Summary of Pay Items ProjectProject ProposalProposal –Pay Item Average Unit Cost –Bridge History Report

19
Public –Same access as Designer, but READ ONLY –Essentially a Reviewer role Estimator –Same access as Designer and Public, AND reports to assist in the preparation of estimates –Reports to aid in post-bid evaluations (customized for FDOT) User Roles
 User Roles")
20
Let’s Get Started!!

21
Web Address: http://www3.dot.state.fl.us/trnsport2/

22
Login Screen Enter User IDEnter Password

23
Web Interface Menu

24
Select View/Update Control Group

25
Select Process Deletes Check Unwanted Categories

26
Select Update

27
Select Bridge TypeSelect Update CategoryCode WidthCode Length 010175

29
Pay Item Coding

30
Click Process Items

31
Update Items and Quantities Resubmit Items

32
Select Return To Category

33
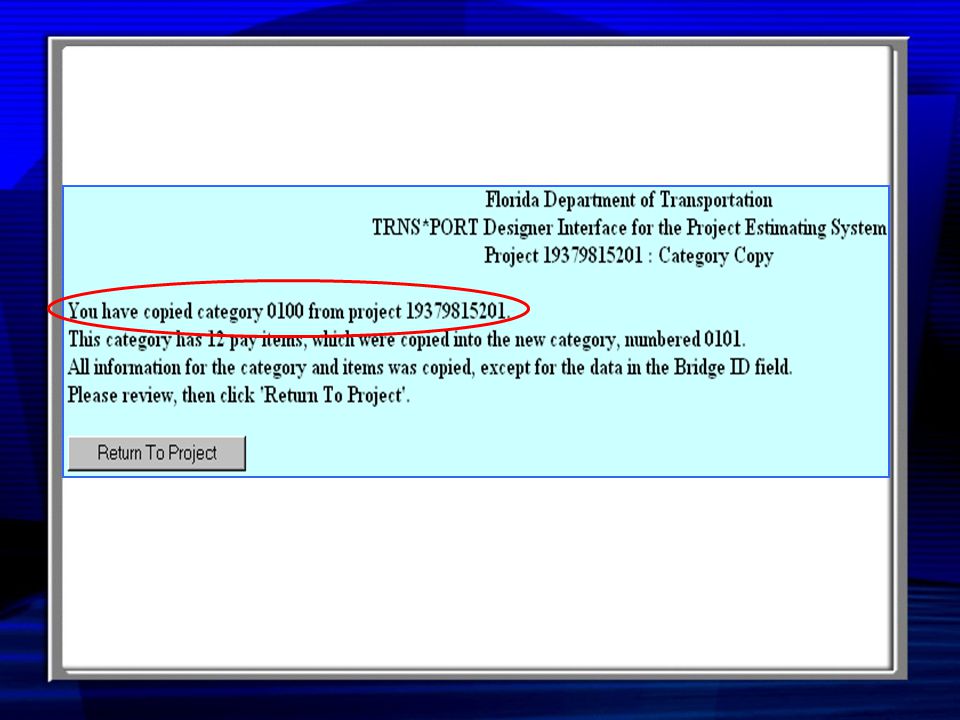
Click Copy Selected Category Click Add Category

35
? Select Update

36
Enter Bridge ID Select Update Category

37
Check UPD/DEL Items Select Process Updates/Deletes 700

38
Click Return To Project

39
Select Update

40
Update Stations Click Update Category

41
Click Add New Items

42
Enter Quantity Enter Item #’s Select Process Items

43
Select Return to Category

44
Select Items

45
Enter Quantity Enter Item #’s Select Process Items

46
Select Return To Category

47
Click To Minimize

49
Enter Project Number

50
Summary

51
Revision: Add Signalization Category Now we need to make a change… Go back to the Interface…

52
Select Add Category

53
Select TypeClick 05 Signalization Select Add Category

54
Select Enter Items

55
Enter Quantity Enter Item #’s Select Process Items

56
Select Return To Category

57
Select Return To Project

58
Select Items

59
Select Add New Items

60
Select Process Items Enter Quantity Enter Item #’sEnter Alt. Code

61
Select Return To Category

62
Select Return To Project List

63
Click to Minimize

68
Click SubmitEnter Financial Project

70
Questions?

Similar presentations


 414-4197 SC 994-4197>")


