Download presentation
Presentation is loading. Please wait.

1
IGCSE Physics Sound

2
Sound Aims: To describe how to measure the speed of sound in air by a simple direct method. To use an oscilloscope to determine the frequency of a sound wave and appreciate that the pitch of a sound depends on the frequency of vibration, To appreciate that the loudness of a sound depends on the amplitude of vibration,

3
Sound cannot travel though a vacuum
Sound is made up of the vibrations of atoms or molecules passing through a substance, and so without atoms or molecules (i.e. in a vacuum) sound cannot travel
 sound cannot travel.")
4
When the pump is turned on, the bell sounds quieter and quieter as the air is pumped out. Eventually, it can hardly be heard at all - thought he gong can still be seen striking the bell. This is because the sound from the bell cannot travel though a vacuum, but light can. The bell does not become totally silent, since some of its vibrations are transferred to the container - the foam rubber helps to reduce this effect.

5
Speed of Sound

6
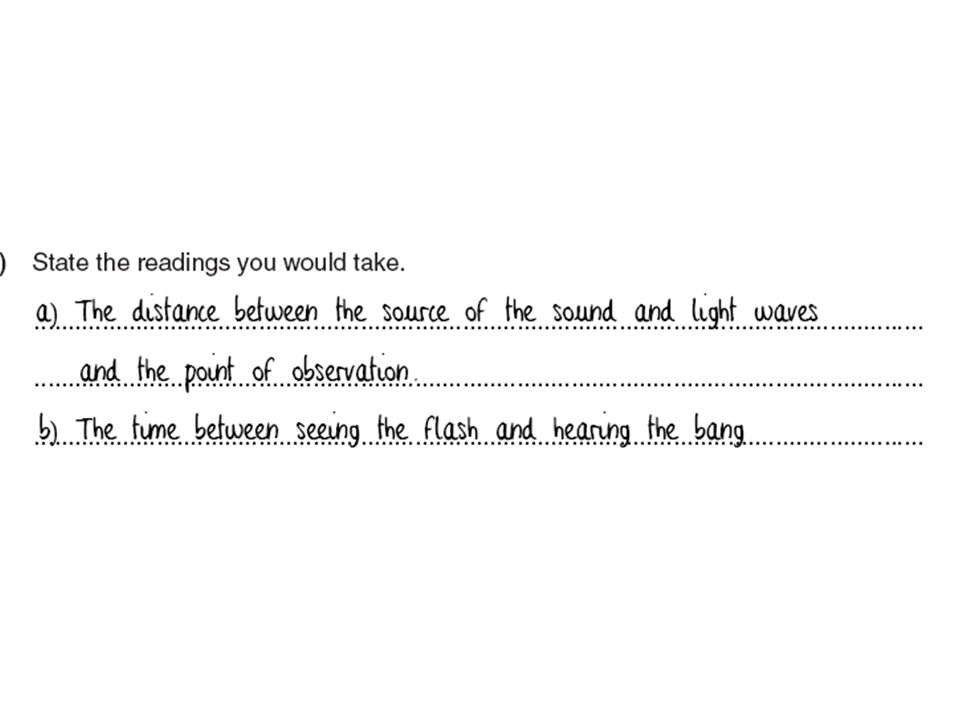
START STOP You need a quiet open space at least 100 m long
to perform this investigation. START STOP 100 m 1. When you see the cymbals crash, press START. 2. When you hear the cymbals crash, press STOP.

7
Record the results of your sound experiments in a table. 1 2 3 4 100
distance (m) time (s) speed (m/s) 1 2 3 4 100 0.34 294 How are these values used to estimate the speed of sound? distance time speed = = 100 0.34 = 294 m/s
 time. (s) speed. (m/s) How are these values used to estimate the speed of sound distance. time. speed = = = 294 m/s.")
8
340 m/s The speed of sound in air is about…
Use the results of the cymbals experiment to calculate your average speed of sound. How does your calculation for the average speed of sound compare with the real speed? What errors could have affected the results of your cymbals experiment? Do you think the speed of sound in water is the same as it is in air?

9
Measuring speed with echos
START 150 m STOP Stand at least 100 m from a large, flat wall with a stop watch. 1. Use a starting pistol (or clapper board) to make a sound. 2. Measure the time taken between firing the pistol and hearing the echo. How far does the sound travel?
 to make a sound. 2. Measure the time taken between firing the pistol and. hearing the echo. How far does the sound travel")
10
distance time speed = = 300 0.92 = 326 m/s
The sound of the starting pistol takes 0.92 s to travel a distance of 300 m. How can you use this result to estimate the speed of sound? distance time speed = = 300 0.92 = 326 m/s Repeat the experiment several times to obtain an average. How does your calculation for the average speed of sound compare with the real speed?

11
Draw a labelled diagram of the arrangement of suitable apparatus for the experiment.

13
Speed of sound in different materials
The speed at which it travels though a material will therefore depend on how close together the molecules are, and so upon the density of a material - the more tightly packed the molecules, the more quickly vibrations can be transferred from molecule to molecule, i.e. the faster the sound can travel though the material.

14
Speed of sound in different materials
The speed of sound is approximately: 340m/s in air - gas molecules are relatively far apart, and the transfer of vibrations (sound) is relatively slow 1400m/s in water - liquid molecules are much closer together, and transfer of vibrations is much more rapid 6000m/s in steel - solid molecules are even closer together, and transfer of vibrations is even more rapid
 is relatively slow. 1400m/s in water - liquid molecules are much closer together, and transfer of vibrations is much more rapid. 6000m/s in steel - solid molecules are even closer together, and transfer of vibrations is even more rapid.")
15
Speed of sound in different materials
vgas<vliquid<vsolid Soft materials dampen sound; hard materials reflect it (echoes and reverberations).
.")
16
Visualising sound Describing a sound wave with diagrams or equations makes it easier to communicate our ideas.

17
The Loudspeaker

18
Paper cone moves backwards and forwards

19
When the cone moves forwards it compresses the air next to the speaker

20
When the cone moves backwards it rarefies the air next to the speaker

21
H L The compressions and rarefactions move away from the speaker as sound waves Pressure HIGH HIGH LOW LOW

22
Pressure Higher frequency sounds (higher pitch) mean that the speaker vibrates backwards and forwards more often
 mean that the speaker vibrates backwards and forwards more often.")
23
Sound Waves

24
Sound Waves Amplitude

25
Sound Waves Wavelength

26
Sound Waves Wavelength

27
Wavelength

28
Oscilloscope One button can change the width of the wave on the screen so that you can measure the frequency even if the wavelength is very large or very small. An oscilloscope can show an electrical signal on its screen. One button can change the height of the wave on the screen so that you can measure the amplitude even if it is very large or very small.

29
Looking at Sound Waves A low frequency sound at a medium volume Trace
Microphone A low frequency sound at a medium volume Oscilloscope

30
What is the difference between the sound wave of a quiet sound and a loud sound?
The loud sound has taller waves. The louder the sound, the greater the amplitude. What would the sound wave of a very loud sound look like?

31
low pitch sound high pitch sound
What is the difference between the sound wave of a low pitch sound and a high pitch sound? low pitch sound high pitch sound The high pitch sound has a shorter wavelength, so more waves are visible. It has higher frequency waves. What would the sound wave of a very low sound look like?

32
Looking at Sound Waves A higher frequency sound at a lower volume

33
Looking at Sound Waves A low frequency sound at a low volume

34
Looking at Sound Waves A high frequency sound at a high volume

35
A B Which trace represents the loudest sound? Sound A is the loudest.
Sound A has the largest amplitude, which means the wave has more energy and so the sound is louder.

36
A B Which trace represents the sound with the highest pitch?
Sound B is the highest pitched. Sound B has the shortest wavelength and the most number of waves visible, so it has the highest frequency.

37
Match the description to the oscilloscope pattern:
B C D 1. Low-pitched sound, very loud D 2. Loud, high-pitched sound C 3. Medium sound with medium pitch B 4. Quiet, high-pitched sound A

38
Match the oscilloscope traces to the source of the sound.
B C D 1. A flute playing a single clear note B 2. A dog whistle C 3. A milk bottle dropped onto a floor D 4. A rumble of thunder A

40
Amplitude and Frequency
The human can hear sound between about 20Hz and 20,000Hz. Amplitude & Frequency

41
Ultrasonic waves A signal generator can produce electrical signals which can be converted to sound waves by a speaker. The sound waves can be greater than the hearing range for humans (ultrasonic waves). Ultrasonic waves can be used in industry for cleaning, quality control, and for pre-natal scanning Ultrasonic waves
. Ultrasonic waves can be used in industry for cleaning, quality control, and for pre-natal scanning. Ultrasonic waves.")
42
Ultrasonic waves Ultrasonic waves

43
Uses of sound a. Acoustics – the study of sound. Soft materials dampen sound; hard materials reflect it (echoes and reverberations). b. SONAR – Sound Navigation and Ranging (echolocation). c. Ultrasound imaging d. Kidney stones & gallstones.
. c. Ultrasound imaging. d. Kidney stones & gallstones.")
44
Oscilloscopes in detail
Oscilloscopes can be complicated but we need to know how to work out frequency from the image on the screen.

45
Oscilloscope picture

46
Oscilloscope diagram The height of the wave on the screen is the amplitude of the signal and can be controlled by the ‘volts/div’ dial. The width of the wave on the screen is the frequency of the signal and can be controlled by the ‘time base’ or ‘time/div’ dial.

47
Reading the screen The height of the screen shows the amplitude or voltage of the signal. The width of the screen can be used to determine the frequency of the signal if it is changing.

48
1 cm squares Each large square is one centimetre wide.
Each little division is two millimetres apart. The middle horizontal line displays zero voltage.

49
d.c. signals 1 If the scale of the oscilloscope is set to 4V per division. This signal would be -8 volts.

50
d.c. signals 2 If the scale of the oscilloscope is set to 0.2V per division. This signal would be volts.

51
d.c. signals 3 If the scale of the oscilloscope is set to 1V/division.
This signal would be -2.8 volts.

52
d.c. signals 4 The scale has been set to 1V/division.
The signal is still d.c. It is changing from 1 V to 3 V but is always positive.

53
a.c. signals 1 This is a correct a.c. signal.
At 1 cm per volt it has an amplitude of 2 volts. It contains both positive and negative voltages.

54
Timebase controls horizontal speed

55
Timebase in action 2

56
Changing the volts/division

57
Calculating frequency
To work out the frequency of the wave displayed on the screen you need to do three things: Measure a complete wave on the screen in cm, Multiply this number by the ‘Timebase’ setting to get the period, The frequency = 1 period.

58
Example calculation 1 The wavelength of a signal on an oscilloscope screen is 3 cm long. The timebase setting is 0.1 s/div. Wavelength = 3 cm Period = 3 × 0.1 s = 0.3 s Frequency = 1 0.3 = 3.33 Hz

59
Example calculation 2 The wavelength of a signal on an oscilloscope screen is 4 cm long. The timebase setting is 0.01 s/div. Wavelength = 4 cm Period = 4 × 0.01 s = 0.04 s Frequency = 1 0.04 = 25 Hz

60
Example calculation 3 The wavelength of a signal on an oscilloscope screen is 5 cm long. The timebase setting is 0.1 ms/div. (1 ms = s) Wavelength = 5 cm Period = 5 × s = s Frequency = 1 = 2000 Hz

61
Summary – Picturing Sound
A starting pistol can be used to measure the speed of sound by using the difference in speed between light and sound, the bigger the distance the better the result. An oscilloscope can be used to display the frequency and amplitude of a sound wave. If the wavelength on the screen in cm is multiplied by the timebase we can work out the period of the wave. 1/period = frequency. The bigger the amplitude, the louder the sound. The closer the waves, the higher the pitch.

Similar presentations


 describe the production of sound by vibrating sources (b) describe the longitudinal.>")


