Download presentation
Presentation is loading. Please wait.

1
Alexandria University Faculty of Science Computer Science Department
Introduction to Programming (CS 102)
")
2
The Program Development Life Cycle
Creating new programs is called program development. Creating successful applications requires planning Computer professionals need to develop new or modified applications from time to time The process associated with creating successful applications programs is called the program development life cycle (PDLC).
.")
3
The Program Development Life Cycle

4
1. Problem Analysis During analysis, a systems analyst and programmer:
review specifications, and talk with users to fully understand what the software should do. Documentation consists of: program specifications, timetable, which language will be used, how the program will be tested, and what documentation is required.

5
2. Program Design Program design: stage where program specifications are expanded into a complete design of the new program. Structured programming and object-oriented programming are two of the most significant approaches to the design process.

6
Program Design: Program Design Tools
Program design tools are planning tools. Structure charts Program flowcharts Pseudocode Data modeling

7
Structure Charts Structure charts depict the:
overall organization of a program, and how the modules of a program are defined and how they connect to each other hierarchically. Program modules should be arranged hierarchically in a top-down fashion Why?? So that their relationship to each other is apparent.

9
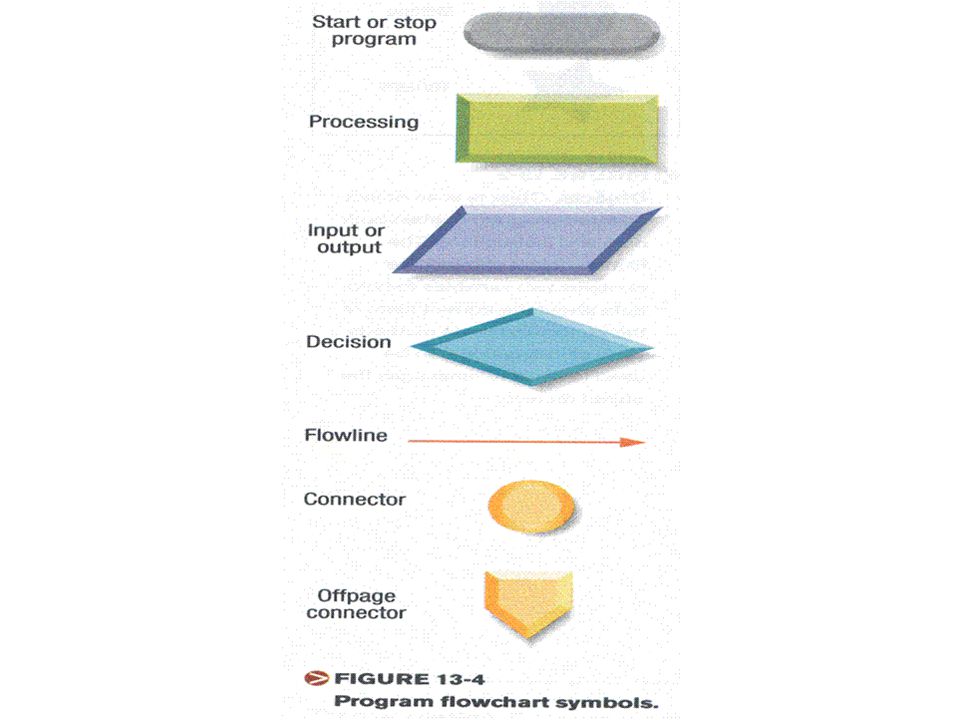
Flowcharts Use geometric symbols and familiar relational operators to provide a graphic display of the sequence of steps involved in a program Different symbols are used to represent different actions such as Start/stop Decision Input/output Processing Looping symbols

13
Pseudocode Uses English-like statements in place of the graphic symbols of the flowchart. Unlike a flowchart, pseudocode is easy to modify and can be embedded into a program as comments. No standard set of rules exists for writing pseudocode, although a number of conventions have been developed.

15
Program Design: Program Design Tools
Data modeling is a technique used to illustrate the data in an application and is frequently used with object-oriented programming. In a data model, the objects in the program are identified, along with their variables and class.

16
Program Design: Good Program Design
n Good program design is essential; it can save time and it produces a better end result. Some principles of good program design are: Be specific One-entry-point, one-exit-point rule No infinite loops Documentation during program design includes all the design specifications

18
3. Program Coding Coding: actual process of creating the program in a programming language. Programming language must be chosen. Coding standards should be adhered to. Make use of reusable code and data dictionaries. Translate coded programs into executable code. Documentation results in finished source code.

20
3. Program Coding cont’d The coded program is referred to as source code. To be executed, the program is converted by the computer to object code using a special program. A compiler translates the entire program into machine language before executing it. The program then doesn’t need to be recompiled until it is modified. An interpreter translates program statements one at a time. Interpreters are helpful during the debugging stage, but are slower during execution of the finished program. An assembler converts assembly-language statements into machine language.

22
4. Program Debugging and Testing
Debugging: process of making sure a program is free of errors or bugs. Preliminary bugging often finds syntax or logic errors. Testing can consist of alpha or beta testing. Documentation includes a copy of the finished program code, plus test data and results.

23
4. Program Debugging and Testing cont’d
Preliminary debugging begins after the program has been entered into the computer system. Rarely is a program error-free the first time it runs. Two common types of errors are syntax errors and logic errors: A syntax error occurs when the programmer has not followed the rules of the language. A logic error, or execution-time error, results when the command syntax is correct but the program is producing incorrect results.

24
5. Program Maintenance Program maintenance: process of updating software so that it continues to be useful. A costly process, but can be used to extend the life of a program. Documentation consists of amended program package reflecting what problems occurred and what program changes were made.

25
What Is a Programming Language?
A programming language is a set of rules used to write instructions to the computer.

26
Categories of Programming Languages
Low-level languages High-level languages Fourth-generation languages (4GLs) Natural and visual languages
 Natural and visual languages.")
27
Machine and Assembly Languages
Machine and assembly languages are called low-level languages Programmers who code in them must write instructions at the finest level of detail, the base level of the hardware Virtually no one writes machine-language programs anymore All programs must be translated by a language translator into machine language before they are executed Assembly languages are fast and consume little storage when compared with higher-level languages, but take longer to write and maintain

28
High-Level Languages · High-level languages differ from their low-level predecessors in that they require less coding detail and make programs easier to write. Programs written in a high-level language (BASIC, COBOL, Pascal, C, etc.) need to be translated into machine language before they can be executed.
 need to be translated into machine language before they can be executed.")
29
Fourth Generation Languages (4GL)
Very-high-level languages that are much easier to use than the high-level languages They are declarative rather than procedural languages. For instance, to draw a bar chart in a procedural language, you must tell the computer how to draw bars and where to place them. In a declarative language, you may be able to just point to the data you want graphed, click several menu choices, and you’re in business. Fourth-generation languages are commonly used to access databases (query languages).
.")
30
Popular Programming Languages
FORTRAN COBOL Pascal BASIC and Visual Basic C, C++, AND C# Java

32
Markup Languages Markup languages use symbols or tags to describe what a document should look like when displayed. HTML (Hypertext Markup Language) Dynamic HTML XML (extensible markup language) XHTML (extensible Hypertext Markup Language) WML (Wireless Markup Language )
 Dynamic HTML. XML (extensible markup language) XHTML (extensible Hypertext Markup Language) WML (Wireless Markup Language )")
34
Scripting Languages Scripting languages are used to build program instructions into Web pages, usually to add dynamic content. JavaScript VBScript Perl

36
Flowcharts Understanding the basic parts of the flowchart and the advantages and limitations of flowcharts.

37
Definition Flowcharts a diagrammatic representation that illustrates the sequence of operations to be performed to get the solution of a problem.

38
How to Write a Program? Start Define Problem to Solve
Think of an Algorithm Think of a Technique for the Solution Write Solution on a Piece of Paper If not Finished Repeat Steps 4 and 5 Write Code and Program Debug and Test If not Finished Repeat Steps 7 and 8 Stop

39
How to Write a Program? Start Job Done No Define Problem to Solve
Think of an Algorithm (Technique for the solution) Yes Write Code and Program Idea!!!! Debug and Test Think of a Technique for the solution Job Done No Yes Stop Write it down on a piece of paper (before you forget it!!!)
 Yes. Write Code and Program. Idea!!!! Debug and Test. Think of a. Technique for the solution. Job Done. No. Yes. Stop. Write it down. on a piece of paper. (before you forget it!!!)")
40
Algorithms A computer program makes use of algorithms
Algorithm is a complete step-by-step procedure for solving a problem or accomplishing a task.

41
Standard Flowchart Symbols
Start Or Stop Process Start Print Results Input/Output A On-Page Connector ? Yes No Condition Calculate Variables Process Rectangle A1 Off-page Connector

42
Example of Flow Charts

43
Basic Flow Chart Operations
All computer instructions are based on four basic processing patterns: Simple Sequence Selection Pattern Loop Pattern Branch Pattern

44
Simple Sequence Logic involves executing instructions one statement after another, in the order presented by the program. This is the simplest and most-used pattern. The computer assumes that all instructions are to be executed in this order unless the program presents other instructions.

45
Example of a Simple Sequence
Read Names Compare with Criteria Print Eligible Names

46
Selection Pattern Requires that the computer make a choice among two or more items. Each choice is based on one of two comparisons a computer can make: true or false (Yes or No).
.")
47
Example of a Selection Pattern
? Honour Student No Yes List under Student Loan List under Scholarships

48
Loop Pattern Causes an interruption in the normal sequence of processing and directs the computer to loop back to a previous statement in the program, repeating the same sequence over again, usually with new data. By looping, the programmer avoids having to repeat the same set of instructions over and over.

49
Example of a Loop Pattern
? More Names No Yes Compare with Criteria Print Eligible Names

50
Branch Pattern Is often used in combination with selection or looping.
The branch pattern allows the computer to skip statements in a program. The branch encourages undisciplined jumping around among program statements, a characteristic that is frowned on by most programming experts. Branching is difficult to follow and is an inefficient use of computer power.

51
Example of a Branch Pattern
? Honour Student No 1 Yes Read Area of Concentration Read Courses Taken 1 Compare with Criteria

52
Types of Flowcharts Functional Chart Process Flow Chart
A chart that is used to describe how activities interact with one another within an organization as well as with other organization and/or systems. Process Flow Chart A chart that is used to describe the sequence and relationship of the tasks that make up an activity 3. Process Flow Description Chart Detailed description of the tasks outlined in a Process Flow Chart Typically used to show the kinds of tasks performed within a process (the number of operations, review, and transfers; and the amount of storage and time required to complete an activity)
")
53
Uses of Flowcharts Flowcharts are generally drawn in the early stages of formulating computer solutions. Flowcharts facilitate communication between programmers and business people. Flowcharts play a vital role in the programming of a problem and are quite helpful in understanding the logic of complicated and lengthy problems. Once the flowchart is drawn, it becomes easy to write the program in any high level language. Often we see how flowcharts are helpful in explaining the program to others. Hence, it is correct to say that a flowchart is a must for the better documentation of a complex program.

54
Advantages of Flowcharts
Communication: Flowcharts are better way of communicating the logic of a system to all concerned. Effective Analysis: With the help of flowchart, problem can be analysed in more effective way. Proper Documentation: Program flowcharts serve as a good program documentation, which is needed for various purposes.

55
Disadvantages of Flowcharts
Complex Logic: Sometimes, the program logic is quite complicated. In that case, flowchart becomes complex and clumsy. Alterations and Modifications: If alterations are required the flowchart may require re-drawing completely. Reproduction: As the flowchart symbols cannot be typed, reproduction of flowchart becomes a problem. The Essentials of what Is Done can easily be lost in the technical details of how it is done

56
Case Study - 1 A certain Company gives each of its sales people $1,000 at the beginning of each month to cover travel, lodging, and food expenses. At the end of the month, a salesperson must total his/her expense receipts. If the amount is less than $1,000 then the difference must be returned to the company.

57
Case Study – 1 (Solution)
Here is an algorithm for figuring how much money, if any, must be returned: Total the expense receipts for the month. 2. Subtract the amount of the expense receipts from 1,000. 3. If the remainder is more than 0, return that amount to the company.

58
Flowchart Start Input Expenses ? E<1000 Yes Subtract Expenses
R <= 1000-E No Print You Owe $0 Print You Owe $R Stop

59
Case Study – 1 (Solution 1)
Assume the Employee has Spent $1250 What would be the amount to return to the company in this case?

60
Solution 1 E = $1250 Start Input Expenses ? E<1000 Yes
Subtract Expenses R <= 1000-E No Print You Owe $0 Print You Owe $R Stop

61
Case Study – 1 (Solution 2)
Now Assume the Employee has spent $950 What would be the amount to return to the company in this case?

62
Solution 2 E = $950 R = 1000 - E E = $50 Start Input Expenses ?
Yes R = E Subtract Expenses R = 1000-E No E = $50 Print You Owe $0 Print You Owe $R Stop

63
Basic Guidelines for Flowcharts
Only one flow line should come out from a process symbol.

64
Basic Guidelines for Flowcharts
< = ? > Only one flow line should enter a decision symbol, but two or three flow lines, one for each possible answer, should leave the decision symbol. Y N ?

65
Basic Guidelines for Flowcharts
Only one flow line is used in conjunction with terminal symbol. Start Stop

66
Basic Guidelines for Flowcharts
Ensure that the flowchart has a logical start and finish. It is useful to test the validity of the flowchart by passing through it with a simple test data.

67
Case Study - 2 Draw a flowchart to find the sum of first 5 natural numbers.

68
Case Study - 2 N Sum 1 1 2 3 3 6 4 10 5 15 Start Sum = 0 N = 0
N = N + 1 1 1 Sum = Sum + N 2 3 ? N = 5 3 6 No 4 10 Yes 5 15 Print Sum Stop

69
Case Study - 3 Draw a flowchart to find the largest of three numbers A,B, and C.

70
Case Study - 3 Start Read A, B, C ? B > C ? A > B ? A > C Yes
No Yes Yes No No Print B Print C Print C Print A Stop

71
Case Study – 3 - (Solutions)
Consider four input cases: A = ; B = ; C = 3 A = ; B = 3 ; C = 7 A = ; B = ; C = 3

72
Case Study – 3 (Solution 1)
Start B = 7 Read A, B, C C = 3 ? B > C ? A > B ? A > C Yes No Yes Yes No No Print B Print C Print C Print A Stop

73
Case Study – 3 (Solution 2)
Start B = 3 Read A, B, C C = 7 ? B > C ? A > B ? A > C Yes No Yes Yes No No Print B Print C Print C Print A Stop

74
Case Study – 3 (Solution 3)
Start B = 3 Read A, B, C C = 3 ? B > C ? A > B ? A > C Yes No Yes Yes No No Print B Print C Print C Print A Stop

Similar presentations


 A program must be free of syntax.>")


