Download presentation
Presentation is loading. Please wait.

1
Climate Change in the Rogue Valley: Current Projections & Reasoned Responses Alan Journet alanjournet@gmail.com / 541-301-4107 alanjournet@gmail.com Professor emeritus, Southeast Missouri State University Now living in Applegate Valley Co-Facilitator http://socan.info For ppt: http://socan.info Projects Presentation Project Scroll down to ‘SOCAN Presentations Delivered’http://socan.info

2
What incited my concern about climate change? 30 years teaching biology at Southeast Missouri State University: Mainly ecology, science methods.

3
What Determines Biological Community Distribution? Average Temperature. Average Precipitation. X

4
So What? MAJOR BIOLOGICAL COMMUNITIES OF THE WORLD These control the agricultural and forestry potential of our land Not only do these represent where our flora and fauna live…but

5
Intergenerational Justice Stewardship Level Playing Field Externalizing waste allows pollution of our air – Newer carbon-free technologies cannot compete with free waste allowance “What have future generations ever done for me?” Free? We all pay the price. 97% of climate Scientists agree – The planet is warming Human caused gas emissions are contributing Anthropocene Era CRITICAL VALUES

6
Are We Sacrificing Our Environment & Future For Short-term Economic Benefit?

7
1995 – Within two weeks - AML Bone Marrow Risk Assessment…. A Personal Example – Why I am addicted to Hopium

8
A Medical Issue Diagnosis and Response Prob. Of Survival 100 50 10 20 30 40 I II III IV My Choices: 1 – Accept the diagnosis Conclude I have cancer, and undergo treatment. But they could be wrong…maybe I don’t have cancer. 2- Deny the diagnosis Conclude I’m fine, and decline treatment. But I could be wrong…maybe I do have cancer. What do you think you’d do? TIME IN MONTHS 12 24NOW 2 1995 AML: No treatment What do you think I did?

9
Global Temperatures 1880 – 2012 cf 1951-1980 10 th warmest in the GISS record 1998 2000-2009 was hottest decade on record Nine of the ten hottest years recorded occurred in that decade GISS = Goddard Institute for Space Studies 2012 1.3 ⁰ F http://data.giss.nasa.gov/gistemp/graphs_v3/Fig.A.gif No-one under 36 has experienced a cooler than (20 th C) average year
 average year")
10
Projected Temperature Trends in Pacific Northwest to 2100 http://cses.washington.edu/db/pdf/wacciach1scenarios642.pdf Historic Data Projections Unavoidable Unmanageable Unknown

11
Rogue Valley Temperature History and Projections 2099 1961-1990 Ave – 50.03 0 F Summer Ave – 63.58 0 F Winter Ave – 38.10 0 F 19002000 1961-1990 Ave – 50.03 0 F Summer Ave – 63.58 0 F Winter Ave – 38.10 0 F

12
Seasonal Patterns compared to 1961-1990 average 2035-2045 Average 1.5 – 4.0 ⁰ F Winter 1– 3.5 ⁰ F Summer 1 – 6.0 ⁰ F August 1.3 – 7.8 ⁰ F 2075-2085 Average 4.3 -8.2 ⁰ F Winter 3.4 -6.3 ⁰ F Summer 5.6 – 11.8 ⁰ F August 6.7 – 16.8 ⁰ F

13
Projected Extreme 1 in 20 year Heat Events by 2080-2099 Global Climate Change Impacts in the U.S. In addition to averages – extremes are important….

14
Projected Days > 100 o F Global Climate Change Impacts in the U.S.

15
Projected Precipitation Seasonal Pattern – High Emissions Scenarios Global Climate Change Impacts in the U.S.

16
Crater Lake (May, 2011)
")
17
Declining Mid-Elevation Snowfall 7,000 – 8,000 ft Source: Crater Lake National Park 25% Reduction N. California 1950 - 2000 Below 7500’ 13% decline Above 7500’ 12% increase Applegate Lake

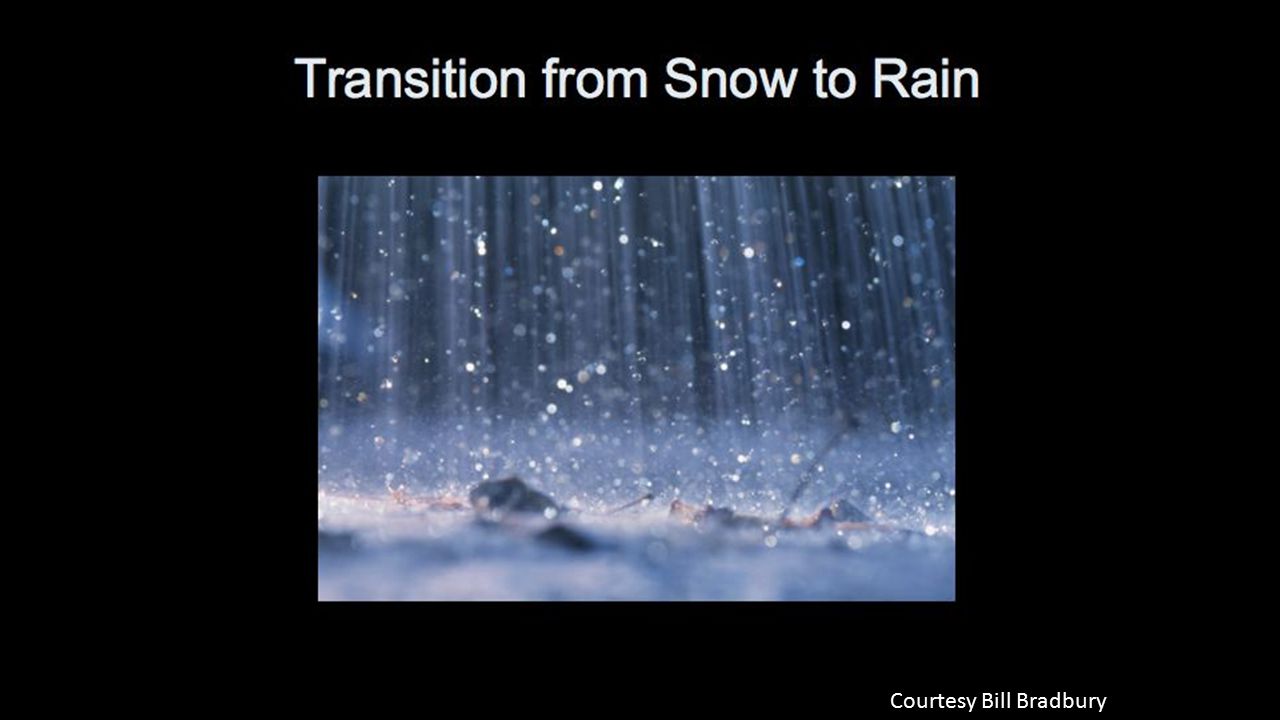
18
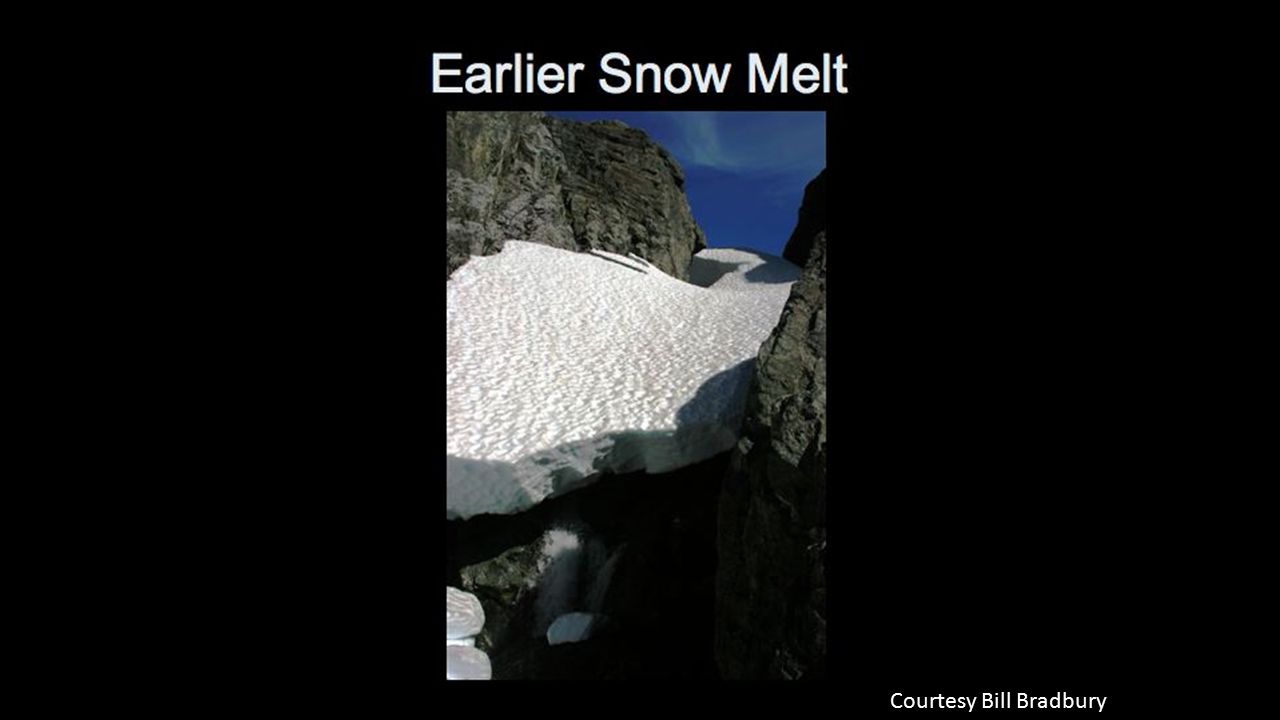
Courtesy Bill Bradbury

23
Jackson County Irrigation Ditches are critical for agricultural productivity For Grapes and Pears

24
CO 2, Temperature and Crop Production Increasing CO 2 may be positive, but increasing temp is negative Global Climate Change Impacts in the U.S.

25
From Interstate 5 – Saturday July 27 th Wolf Creek Area North of Grants Pass Medford Mail Tribune – Glendale Fire July 29 th This could be worst fire season in 10 years

26
http://www.ucsusa.org/global_warming/science_and_impacts/impacts/infographic-wildfires-climate-change.html Western Wildfires & Climate Change

27
http://www.ucsusa.org/global_warming/science_and_impacts/impacts/infographic-wildfires-climate-change.html Western Wildfires & Climate Change

28
Wildfires 1 0 F makes difference between a high fire year and a low fire year. (http://news.discovery.com/earth/climate-change- yellowstone-fires.html )http://news.discovery.com/earth/climate-change- yellowstone-fires.html
 yellowstone-fires.html.")
29
http://www.ucsusa.org/global_warming/science_and_impacts/impacts/infographic-wildfires-climate-change.html Western Wildfires & Climate Change

30
Natural Community Condition Trends 1 - Elimination of spruce/fir/hemlock forest, 2 -Reduction in Douglas fir dominated association, 3 -Possible expansion of Ponderosa pine association, 4 -Expansion of Oregon oak chapparal association, 5 -Expansion of shrubland and grassland.

31
2013 Intergovernmental Panel on Climate Change IPCC AR-5 Fifth Assessment Report 2013-2014 “Warming of the climate system is unequivocal, and since the 1950s, many of the observed changes are unprecedented over decades to millennia. The atmosphere and ocean have warmed, the amounts of snow and ice have diminished, sea level has risen, and the concentrations of greenhouse gases have increased.” Established in 1988 by U.N. Environment Programme and World Meteorological Union. Composed of thousands of atmospheric scientists and climate scientists the world who review literature, evaluate what is happening, and provide consensus summaries. Reported 1990, 1995, 2001, 2007, and now 201/2014. Atmosphere: “Each of the last three decades has been successively warmer at the Earth’s surface than any preceding decade since 1850 …. In the Northern Hemisphere, 1983–2012 was likely the warmest 30-year period of the last 1400 years.” Likely = 66 – 100%

32
2013 Intergovernmental Panel on Climate Change IPCC 2008 The National Intelligence Council: National Security Implications of Global Climate Change to 2030: Drought, severe weather, flooding and refugees, water and resource shortages. 97% of Practicing Climate Scientists agree with 2007 IPCC – 2009, 2010, 2013 peer-reviewed studies “Due to natural variability, trends based on short records are very sensitive to the beginning and end dates and do not in general reflect long-term climate trends. As one example, the rate of warming over the past 15 years (1998– 2012; 0.05 [–0.05 to +0.15] °C per decade), which begins with a strong El Niño, is smaller than the rate calculated since 1951 (1951–2012; 0.12 [0.08 to 0.14] °C per decade). “It is virtually certain that globally the troposphere has warmed since the mid- 20th century.” Virtually Certain = 99 – 100%
, which begins with a strong El Niño, is smaller than the rate calculated since 1951 (1951–2012; 0.12 [0.08 to 0.14] °C per decade). It is virtually certain that globally the troposphere has warmed since the mid- 20th century. Virtually Certain = 99 – 100%.")
33
http://en.wikipedia.org/wiki/Greenhouse_gas B UT 23 X CO 2 296 X CO 2 Approximately 75%> 75% The Problem? Greenhouse gases released by human activity: Carbon dioxide, methane, oxides of nitrogen. 2000 Global Emissions

34
It’s basically about energy production/consumption Reduce energy use – especially when energy is generated by burning fossil fuels (coal, oil, gas); Especially reduce fossil fuel based transportation and electricity generation. Reduce, reuse, recycle. Individual Action A necessary but insufficient condition. Essence of A Solution

35
We Have Choices! Money inflows & outflows Back in the Day… Now…. Energy Accounting $ GHG CO 2 Carbon Accounting Hopium Addiction

36
What produces carbon emissions locally? Good Co, Eugene, OR GHG Inventory http://rvcog.org/cogboard/2011/Dec_14/RVCOG-REA-Final_PPT-121511.pdf

37
Oregon Electric Generation Mix Source: Oregon Department of Energy Fossil fuels >50%

38
Rogue Valley Energy Production and Consumption

39
Average Energy Use in Oregon Homes

40
The ‘low hanging fruit’…

41
Energy Efficiency Pyramid for Home Improvements

42
Increasing CO 2 Mitigation Cost in € per ton = $1.4 Positive = Cost (Negative = Savings) Economic Study Undertaken by McKinsey Consulting Firm © 2010 Actions here cost us money Actions here save us money Let’s think now about the economics of addressing climate change…
 Economic Study Undertaken by McKinsey Consulting Firm © 2010 Actions here cost us money Actions here save us money Let’s think now about the economics of addressing climate change…")
43
Reducing carbon emissions Note I – China = 8.24 Gt U.S. = 5.8 Gt Combined 14 Gt Impact of the Financial Crisis on Carbon Economics © 2010; Per-Anders Enkvist, Jens Dinkel, Charles Lin, McKinsey & Company Note II - Role of Technology

44
Federal Solutions How would a carbon tax work? Levies tax at the point of origin (mine, well, extraction site), The annually increasing tax (or fee) would discourage carbon fuels and make carbon-free alternatives more cost-effective and competitive, Revenue could be used to promote R&D of alternative fuels or be returned to taxpayers as a dividend, Since total emissions are not regulated, effectiveness will depend on the pressures imposed by the tax, and the guess of a ‘correct’ tax to achieve a determined goal. It IS a tax….
, The annually increasing tax (or fee) would discourage carbon fuels and make carbon-free alternatives more cost-effective and competitive, Revenue could be used to promote R&D of alternative fuels or be returned to taxpayers as a dividend, Since total emissions are not regulated, effectiveness will depend on the pressures imposed by the tax, and the guess of a ‘correct’ tax to achieve a determined goal. It IS a tax…..")
45
To those who complain that it’s a tax…. We are currently paying a tax in suffering and economic losses due to heat waves, droughts, severe weather, etc. (some $200 b in U.S. over 2 years). Who should pay the tax? Those benefitting from polluting our atmosphere Or Those suffering. It’s a TAX!!!!
. Who should pay the tax. Those benefitting from polluting our atmosphere Or Those suffering. It’s a TAX!!!!.")
46
http://socan.info Co-Facilitators: Alan Journet alanjournet@gmail.comalanjournet@gmail.com Kathy Conway kathleendconway@gmail.comkathleendconway@gmail.com MEETINGS: Generally Last Tuesday of the month Special Topic Presentation 6:00 – 6:30 pm General Meeting: 6:30 – 8:00 pm Medford Pubic Library, 205 S. Central Ave.

47
Mission & Goal Statement Our Mission: To recognize the urgency for bold action against climate change To promote awareness and understanding about the causes and consequences of climate change To develop solutions and motivate concerned citizens to take action Goal: Collaborating with individuals and organizations throughout the world, we seek a reduction in the global atmospheric carbon dioxide concentration to 350 parts per million. To achieve this, we encourage both personal and governmental actions that reduce carbon dioxide emissions from individual to global levels.

48
Focus Groups CommunityEducation Green EnergyGovernment Natural Resources Projects Bear Creek Salmon Festival CurriculumDivestment WeatherRiparian Restoration Federal GovernmentState Government Presentations StandingTeams Research Media Creative Leadership Circle Meetings on 2 nd Friday, noon-2pm at Talent Library

49
CLIMATE CHANGE IN THE CURRICULUM: Engage regional educators in developing curricular materials promoting in students an awareness and understanding of the science of climate change together with its causes, consequences and counters. Our target is to produce materials that can be used either in the curriculum (i.e. schools or at home) or in extra-curricular situations (youth groups, after school clubs, Nature Centers, Summer Camps, etc.). Next meeting – please come – Thursday October 17 th Phoenix Public Library 4:00 – 6:00 pm. WEATHER REPORTING: In collaboration with NOAA (U.S. Weather Service) staff we are trying to facilitate the inclusion by Weather Reporters of more climate change discussion in reports and analyses. DIVESTMENT: Develop a plan for divestment by city governments, religious groups, other organizations, educational institutions, and individuals from fossil PROJECT TEAMS
 or in extra-curricular situations (youth groups, after school clubs, Nature Centers, Summer Camps, etc.). Next meeting – please come – Thursday October 17 th Phoenix Public Library 4:00 – 6:00 pm. WEATHER REPORTING: In collaboration with NOAA (U.S. Weather Service) staff we are trying to facilitate the inclusion by Weather Reporters of more climate change discussion in reports and analyses. DIVESTMENT: Develop a plan for divestment by city governments, religious groups, other organizations, educational institutions, and individuals from fossil PROJECT TEAMS.")
50
PRESENTATIONS: Offers presentations (and movies) to regional community, school, and service groups on aspects of climate change and how to address it. GOVERNMENT: Engage Federal, State and Local Representatives, Agencies, and their staffs in discussion regarding climate change and how to address it LEGISLATIVE DISTRICT: Developing district-by-district summaries of climate change projections and consequences to educate local media and legislators. NETWORKING: Explores local, regional, and national organizations with which SOCAN might develop a formal relationship, interact, or collaborate on projects. ENERGY: Promoting energy efficiency and alternative energy. PROJECT TEAMS

51
Please join us! For more information: Visit http://socan.infohttp://socan.info Or Contact Alan Journet alanjournet@gmail.comalanjournet@gmail.com 541-301-4107 or Kathy Conway kathleendconway@gmail.comkathleendconway@gmail.com 541-324-4501 Please join us!

Similar presentations


 Emissions.>")


 Initiatives Reduce greenhouse gas emissions. Reduce.>")
 Your Organization (Line #2) Global warming.: Matthieu BERCHER, Master M.I.G.S., University of Burgundy,>")


 Prepared for the National Workshop.>")


 February 2014 Damien Lockie.>")


