Download presentation
Presentation is loading. Please wait.

1
Waterways 1 Water Transportation History

2
Water Transportation Propulsion History Human (oars, poles) - - 7,000-10,000 BC Wind (sails) - - 3,000 BC Steamboat invented - - 1787 AD First diesel-powered ship - - 1912 AD Hovercraft invented - - 1956 AD First nuclear-powered ship launched - - 1958 AD
 - - 7,000-10,000 BC Wind (sails) - - 3,000 BC Steamboat invented AD First diesel-powered ship AD Hovercraft invented AD First nuclear-powered ship launched AD")
3
History in United States Development of the United States Provided early settlers with a link to markets in England and Europe. Major cities developed around water ports on the coast. Development of inland waterways provided settlements in the wilderness and connection to coastal cities

4
Two Major Types of Water Transportation Deepwater – Passenger: cruise ships, ocean liners (19 million to be served globally in 2011) – Freight: bulk carriers, container ships, tankers, reefer ships and roll-on/roll-off ships (8 billion tons shipped globally in 2007) Lakes, Coastal and Inland Waterways – Passenger: ferries (59 million served in U.S. in 2009) – Freight: dry bulk cargo, liquid cargo, and flat deck barges (857 million tons shipped domestically in 2009) – Recreational: fishing and water sports
 – Freight: dry bulk cargo, liquid cargo, and flat deck barges (857 million tons shipped domestically in 2009) – Recreational: fishing and water sports.")
5
Cargo Densities of Global Deepwater Shipping Routes Image courtesy of U.S. Maritime Administration

7
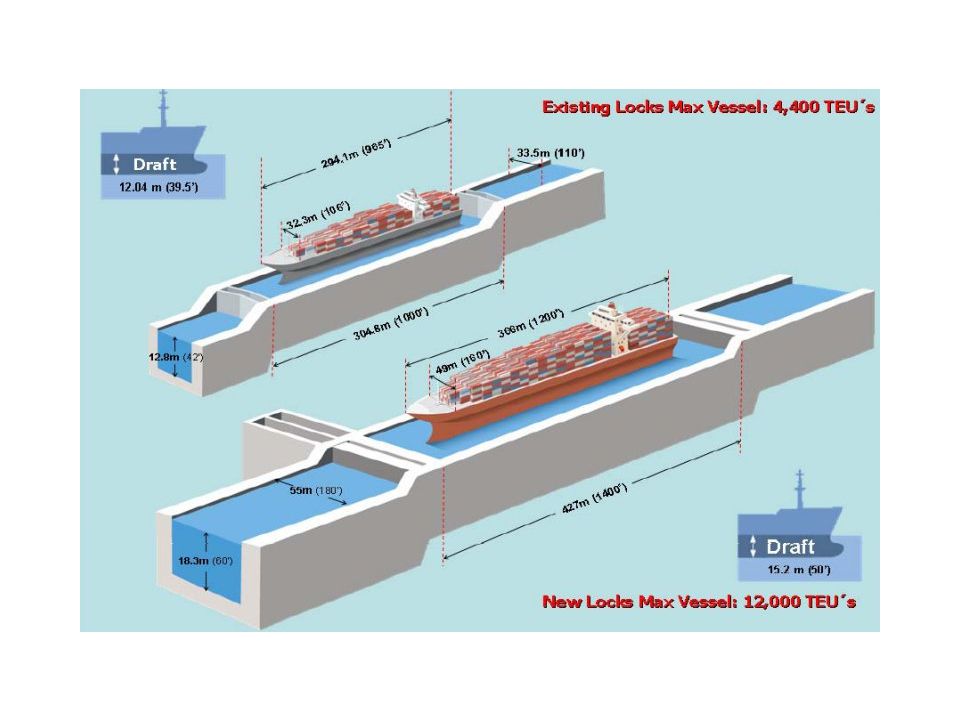
Panama Canal Lock Expansion Project Approved by national referendum in October 2006 by 80% of Panamanians Scheduled completion date in 2014 Estimated cost of $5.2 billion Project is on schedule and under budget Will double capacity of the canal Will allow much larger ships to traverse canal Will alter global shipping patterns

10
Image courtesy of U.S. Maritime Administration

11
Inland/Coastal Waterways 12,000 miles of navigable waterways 240 lock sites Move commerce to and from 38 states Image courtesy of National Waterways Foundation

12
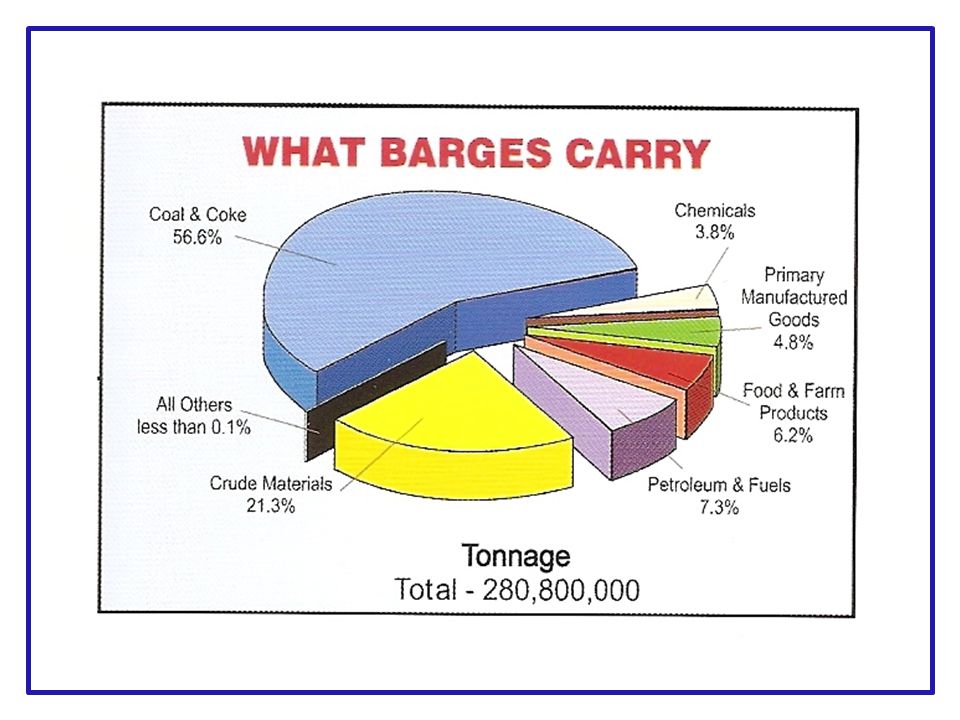
Industry Overview Commodities – Basic raw materials dry (coal, coke, sand, gravel, stone, logs, lumber) – Liquid (petroleum and petroleum products), – Some high-valued products Competes with rail for bulk commodities such as grains, coal, ores, and chemicals. Competes with pipelines for bulk petroleum and petroleum products.

14
Inland Waterways System Components Navigation channel – dredging required at some locations Locks and dams – navigation pools (USACE) Ports and terminals for loading/unloading – publicly and privately owned Fleeting/mooring sites Navigation aids – channel and obstruction buoys (US Coast Guard) River information systems – automatic vessel identification, lock operations management, vessel-to-land communications
 Ports and terminals for loading/unloading – publicly and privately owned Fleeting/mooring sites Navigation aids – channel and obstruction buoys (US Coast Guard) River information systems – automatic vessel identification, lock operations management, vessel-to-land communications")
15
Types of Carriers Private Carriers: cannot be hired and only transports freight for the company that owns or leases the vessel For-Hire Carriers: are hired and charge a fee for their service Common Carriers: serve the general public at a reasonable price Contract Carriers: under contract to service a company

16
Internal Carriers – Operate over the inland waterways. – Use barges, towboats, and operate over the principal rivers (Mississippi, Ohio, Tennessee, Columbia, and Hudson) and some small arteries – Dominate the north-south traffic through the central portion of US Coastal Carriers – Operate along the coasts serving ports on the Atlantic or Pacific oceans of the Gulf of Mexico. – Intercoastal carriers transport freight between East Coast and West Coast ports via the Panama Canal
 and some small arteries – Dominate the north-south traffic through the central portion of US Coastal Carriers – Operate along the coasts serving ports on the Atlantic or Pacific oceans of the Gulf of Mexico. – Intercoastal carriers transport freight between East Coast and West Coast ports via the Panama Canal.")
17
Competition Competes with other modes of transportation Number of carriers in a waterway is limited so there is less competition with one another. Rail: Dry bulk commodities such as grain, coal, and ores Pipeline: Bulk liquids such as petroleum and petroleum products Trucks: Limited competition; trucks work with water to overcome the accessibility constraints water carriers have.

18
Load Size Large capacity Capacity of 1,500 ton barge is equivalent to 15 railcars and 60 trucks High capacity allows water to operate as a low-cost service.

20
Disadvantages Speed – Longest transit time Service Disruption – Disruption in winter and summer months – Increase in costs during the winter months Accessibility – Limited network Packaging – Inclement weather, rough waters, handling

21
Terminals/Ports Public Terminals: most ports are operated by government agencies and have public storage facilities Shipper Terminals: High volume users may invest in private facilities - firms that handling commodities such as grain, coal, and oil may build docks, terminals, and handling facilities to meet their specific needs.

22
Efficient Handling Materials: material improvements and specialized handling equipment to limit delays Ports facilitate transfer of freight from water to rail or truck Storage is necessary at ports and terminals because barges and ships can carry larger loads than trucks or rail cars

23
Cost Structure High variable costs and low fixed costs Controlled and maintained by the government. Carriers only pay user fees (lock fees, dock fees, fuel taxes). Variable Costs: line-operating cost, rent fees, and maintenance costs Fixed Costs: depreciation
. Variable Costs: line-operating cost, rent fees, and maintenance costs Fixed Costs: depreciation.")
24
Infrastructure Infrastructure made possible by public aid Army Corps of Engineers

25
Locks and Dams A method for moving large ships and barges through shallow or steep waterways A stair step method Allows water carriers to transport to areas where terrain would not allow

26
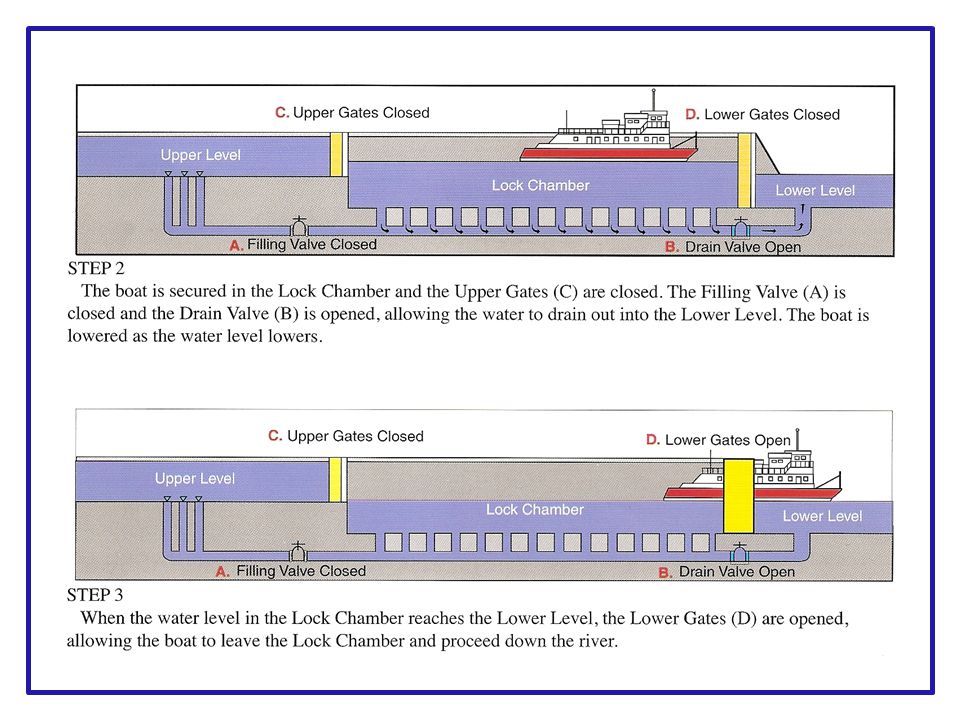
Operation of Locks

28
Fuel Water is the most fuel efficient mode of transportation Consumes more fuel per mile than other modes but able to transport more ton-miles of freight than any other mode.

29
155 miles 413 miles 576 miles Number of Miles One Ton of Freight is Moved on One Gallon of Fuel

30
Current Issues Out of date ports and port development – Aging infrastructure – New boats and technology are making it necessary to update and improve the ports and terminal facilities

31
Kentucky Waterways 10 ferry boat operations 12 public ports 1,269 miles of navigable waterways – Ohio River : 664 miles 2% within state, 11% from state, 13% to state (by weight) shipments by freight tonnage
 shipments by freight tonnage")
33
Seamen’s Church Institute Mariner Simulator Training in Paducah, KY

Similar presentations


>")


