Download presentation
Presentation is loading. Please wait.

1
Transportation Engineering Introduction and Administration Dr. Wen Cheng, P.E., T.E., PTOE June 22 nd, 2010 Cal Poly Pomona

2
Learning Objectives Background information of various transportation modes Transportation demand by mode Administrative structure of transportation system Transportation finance

3
Q1: The two main purposes of transportation system are to provide: _____________movement? _____________movement?

4
Q2: In addition to highway, what are the other 4 modes or components of transportation system?

5
5 Transportation Modes Transportation HighwayRailroadAirWaterPipeline

6
Users select various modes based on… Varying levels of price Various levels of service –Convenience –Speed –Safety –Availability

7
Q3: Why are transportation systems so important?

8
The importance of transportation systems provide mobility services for both people and goods, which is important for economic development and human needs. –16% of the Gross National Products (GNP) –11% of the labor force –13% of all federal taxes
 –11% of the labor force –13% of all federal taxes.")
9
Chapter 1: Introduction of Transportation system of the united states

10
Highway system background information

11
U.S. Highway Classification #1 2 Major functions –Travel mobility –Access to property Functional classifications –Principle arterial (e.g. Freeway and Expressway) –Minor arterial (e.g. intercity road) –Collector (e.g. some major roads within a city) –Local highway
 –Minor arterial (e.g. intercity road) –Collector (e.g. some major roads within a city) –Local highway.")
12
Schematic Illustration of Highway Functional Classification Interstate Highway Major Arterial Minor Arterial Collector Local Street Properties Driveway

13
U.S. Numbered Freeways

14
Q: What are your findings of the following highway numbers?

15
Highway Classification #2 Administrative Classification –Federal-aid system (160,000 miles) –State system (775,000 miles) –Local and county roads Question: 1.The local road represents the largest or smallest percentage of U.S. highway mileage? 2.The highway system is almost entirely privately or publicly owned?

16
Railroad system background information

17
Railroad System Characteristics Freight transport –infrastructure and rolling stock owned by private railroad corporations Passenger transport –infrastructure and rolling stock owned by public railroad corporations – Long-distance inter-city rail travel: AMTRAK –Short-distance travel: commuter rail authorities.

18
Railroad Classification #1 Purposes –Line-haul (convey shipment between urban regions or from agricultural or mineral resource sites to urban sites) –Within urban areas Switching Belt-line Terminal
 –Within urban areas Switching Belt-line Terminal")
19
Railroad Classification #2 Level of operating revenue –Class I railroads ($255.9 m or more) –Class II railroads ($20.5 – $255.8 m) –Class III railroads (less than $20.5 m) –The Surface Transportation Board (STB) manages Class I railroads, the Association of American Railroads (AAR) manages Class II and III railroads.
 –Class II railroads ($20.5 – $255.8 m) –Class III railroads (less than $20.5 m) –The Surface Transportation Board (STB) manages Class I railroads, the Association of American Railroads (AAR) manages Class II and III railroads.")
20
Railroad routes b/w principal cities

21
Question: For the three types of railroad, which one has the largest percentage in terms of the following criteria: –Number of railroads –Mileage operated –Railroad employees

22
Air mode background information

23
2 parts of air transportation Air transportation Airway System Airport System Airway system: provides “space channels” or routes for various airplanes travelling from one place to another. Airport system : functions as the interface between air mode and other transportation mode (highway or railroad mode).
..")
24
Airway System In 1994, total mileage of the airways: 394,000 miles (634,081 km) 2 separate route systems –The low-altitude system (700’~18,000’) –The high-altitude system (18,000’~60,000’) Guidance of aircraft movements is provided by air traffic controllers with the aid of: –Radio-based instrument landing system (ILS) –Radar –Other navigational aids
 2 separate route systems –The low-altitude system (700’~18,000’) –The high-altitude system (18,000’~60,000’) Guidance of aircraft movements is provided by air traffic controllers with the aid of: –Radio-based instrument landing system (ILS) –Radar –Other navigational aids")
25
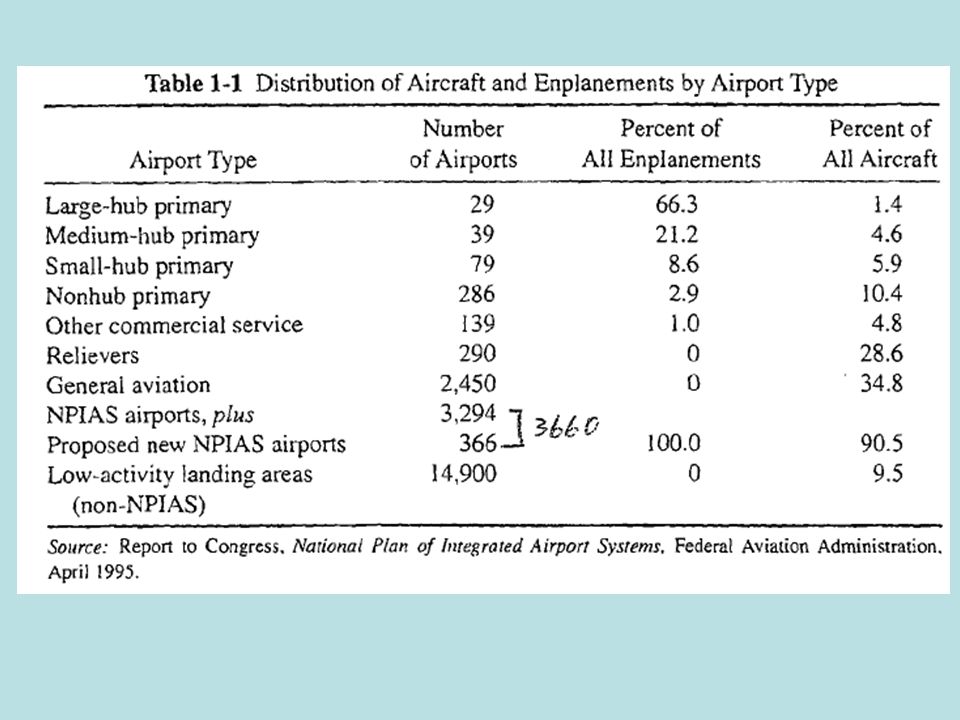
Airport Classification #1 NPIAS (: National Plan of Integrated Airport System) NPIAS airports –Included in the national plan –Eligible to receive grants under the federal airport improvement program Non-NPIAS airports –Do not meet the minimum entry criteria of the NPIAS. >30 min ground travel to the nearest NPIAS airports > 10 based aircraft

26
Airport Classification #2:Functional

29
Water transportation system background information

30
Water transport components Water transport waterways Ocean (sea) Inland Harbors and ports Water: provide water routes for vessels going from one place to another place. Harbors and ports: provide a transition place between water transportation mode and other modes.

31
Inland transportation system The navigable depth is: > 9ft (2.7 m); total mileage: 25,543 miles Two agencies: –The Corps of Engineers: construction and maintenance of the inland waterway system. –The US Coast Guard: the supply and operation of the navigation aids along the waterways. Three major divisions: – inland rivers and canals –Coastal waterways –Great Lakes system (Michigan, Ontario, etc.)
.")
33
Pipeline system background information

34
Pipeline system Oil pipeline operations that engage in interstate commerce carriage are controlled by the Federal Energy Regulatory Commission (FERC). Private companies own pipeline systems. –No government aids. Pipeline system Oil pipelines Gathering lines Trunk lines Gas pipelines Field lines Trunk lines

36
Transportation Demand by Mode

37
Overall transportation demand What is the indication of this figure?

38
Shares of domestic ton mileage of freight

39
Conclusion of share of freight transport Rail transport, the dominant mode. Market is long-distance shipments Truck, a rapidly growing mode. Market is short-distance shipments Inland waterway, a stable mode. Market is bulky and low cost goods Oil pipeline, oil and oil products A neglect share for air transportation

40
Shares of domestic passenger-miles

41
Conclusion of share of passenger transport Auto, the dominant mode. Air, a rapidly growing mode. Rail, bus, and inland passenger transportation accounts for small share.

42
Administrative Structure

43
Divisions of government Government LegislativeExecutiveJudicial

44
Federal legislative committees Senate Committees: –Committee on Environment and Public Works ( water navigation and highway construction and maintenance ) –Committee on Commerce, Science, and Transportation ( other modes ) House Committee: –Committee on Transportation and Infrastructure ( all elements of transportation )
 –Committee on Commerce, Science, and Transportation ( other modes ) House Committee: –Committee on Transportation and Infrastructure ( all elements of transportation )")
45
Federal regulatory agencies The Surface Transportation Board (STB) –charges on regulations of rail, motor carriers, rail-water connections, and pipeline The Federal Energy Regulatory Commission (FERC) –responsible for setting up rates and practices of oil pipeline companies
 –charges on regulations of rail, motor carriers, rail-water connections, and pipeline The Federal Energy Regulatory Commission (FERC) –responsible for setting up rates and practices of oil pipeline companies")
46
Executive branch: DOT Federal level: USDOT State level: State DOT Local level: a wide variety of agencies –Note: Ports, airports, and public transit agencies generally exist as an arm of local rather than state government

47
Transportation associations AASHTO TRB ASCE ITE AAR AAPA etc.

48
Transportation Finance

49
Federal financial aid (1995 example) Highway $19.1 billions (56.3%) Airport and airways $9.2 billions (27%) Transit $2.8 billions (8.3%) Railroad $1.4 billions (4.2%) Rivers/Harbors $1.4 billions (4.2%) Overall: near $34 billions Q: what are the sources of the aid?
 Highway $19.1 billions (56.3%) Airport and airways $9.2 billions (27%) Transit $2.8 billions (8.3%) Railroad $1.4 billions (4.2%) Rivers/Harbors $1.4 billions (4.2%) Overall: near $34 billions Q: what are the sources of the aid")
50
Highway Finance –Highway user taxes Fuel tax Registration taxes Special tax on commercial vehicles –Property tax –Tolls –Miscellaneous (parking fees, etc.)
")
51
Airport and airway finance Airport Finance –State and Federal Grants Aviation Fuel taxes Airport and Airway Trust Fund –Local Taxes –Operating Revenues (hangar rental, parking, etc.) Airway Finance –Airport and Airway Trust Fund
 Airway Finance –Airport and Airway Trust Fund")
52
Finance of other modes Railroad –Federal Aid to National Railroad Passenger Corporation (AMTRAK) –Operating Revenues Transit –Federal, state, and local aids –Operating revenues –Other Water transport –Operating revenues –State and local aids for capital improvements –Federal aids
 –Operating Revenues Transit –Federal, state, and local aids –Operating revenues –Other Water transport –Operating revenues –State and local aids for capital improvements –Federal aids")
53
THANK YOU!!!

Similar presentations


>")


