Download presentation
Presentation is loading. Please wait.

1
The DISCUSSION Purpose: to interpret your results and justify your interpretation

2
The DISCUSSION Purpose: to interpret your results and justify your interpretation

3
The DISCUSSION Purpose: to interpret your results and justify your interpretation Guidelines for Constructing the Discussion

4
The DISCUSSION Purpose: to interpret your results and justify your interpretation Guidelines for Constructing the Discussion Focus on the main results and conclusion.

5
The DISCUSSION Purpose: to interpret your results and justify your interpretation Guidelines for Constructing the Discussion Focus on the main results and conclusion. - Restate the key result.

6
The DISCUSSION Purpose: to interpret your results and justify your interpretation Guidelines for Constructing the Discussion Focus on the main results and conclusion. - Restate the key result. - State the main conclusion.

7
The DISCUSSION Purpose: to interpret your results and justify your interpretation Guidelines for Constructing the Discussion Focus on the main results and conclusion. - Restate the key result. - State the main conclusion. Be clear about why results support this conclusion.

8
The DISCUSSION Purpose: to interpret your results and justify your interpretation Guidelines for Constructing the Discussion Focus on the main results and conclusion. - Restate the key result. - State the main conclusion. Be clear about why results support this conclusion. Maintain connection with purpose of the study.

9
The DISCUSSION Purpose: to interpret your results and justify your interpretation Guidelines for Constructing the Discussion Focus on the main results and conclusion. - Restate the key result. - State the main conclusion. Be clear about why results support this conclusion. Maintain connection with purpose of the study. Interpret in context of literature.

10
The DISCUSSION Purpose: to interpret your results and justify your interpretation Guidelines for Constructing the Discussion Focus on the main results and conclusion. - Restate the key result. - State the main conclusion. Be clear about why results support this conclusion. Maintain connection with purpose of the study. Interpret in context of literature. - Present/compare with results of and methods used in other studies on same/similar topics.

12
“Perhaps the most disturbing finding in the table is that low numbers of impaired drivers on the road are not accompanied by proportionately low numbers of impaired drivers in fatal crashes.” ???

13
Secondary References Secondary references interpret the work of other authors and researchers. A comparison of secondary sources with one another and to primary sources allows a more balanced viewpoint. Authors should separate fact from opinion. A Writer's Resource: Finding and Using References. Gilbride, JA. Topics in Clinical Nutrition: Volume 19(4), October/November/December 2004, p 326–337
, October/November/December 2004, p 326–337.")
14
Secondary References Secondary references interpret the work of other authors and researchers. A comparison of secondary sources with one another and to primary sources allows a more balanced viewpoint. Authors should separate fact from opinion. A Writer's Resource: Finding and Using References. Gilbride, JA. Topics in Clinical Nutrition: Volume 19(4), October/November/December 2004, p 326–337
, October/November/December 2004, p 326–337.")
15
“Recent fatality research in Scandinavia has shown to an astonished public that the role of alcohol in fatal crashes in the northern countries is only marginally less than in countries with much higher alcohol consumption and far more drinking drivers on the road.” or

16
A Dictionary of Useful Research Phrases "It has long been known..."

17
A Dictionary of Useful Research Phrases "It has long been known..." I didn't look up the original references.

18
A Dictionary of Useful Research Phrases "It has long been known..." I didn't look up the original references. "It is believed that..."

19
A Dictionary of Useful Research Phrases "It has long been known..." I didn't look up the original references. "It is believed that..." I think.

20
The DISCUSSION Purpose: to interpret your results and justify your interpretation Guidelines for Constructing the Discussion Focus on the main results and conclusion. - Restate the key result. - State the main conclusion. Be clear about why results support this conclusion. Maintain connection with purpose of the study. Interpret in context of literature. - Present/compare with results of and methods used in other studies on same/similar topics. - Emphasize strengths of study and what is new/useful.

21
The DISCUSSION Purpose: to interpret your results and justify your interpretation Guidelines for Constructing the Discussion Focus on the main results and conclusion. - Restate the key result. - State the main conclusion. Be clear about why results support this conclusion. Maintain connection with purpose of the study. Interpret in context of literature. - Present/compare with results of and methods used in other studies on same/similar topics. - Emphasize strengths of study and what is new/useful. State limitations/caveats (frankly, without apology).
..")
22
The DISCUSSION Purpose: to interpret your results and justify your interpretation Guidelines for Constructing the Discussion Focus on the main results and conclusion. - Restate the key result. - State the main conclusion. Be clear about why results support this conclusion. Maintain connection with purpose of the study. Interpret in context of literature. - Present/compare with results of and methods used in other studies on same/similar topics. - Emphasize strengths of study and what is new/useful. State limitations/caveats (frankly, without apology). Make recommendations.
. Make recommendations..")
23
The DISCUSSION Purpose: to interpret your results and justify your interpretation Guidelines for Constructing the Discussion Focus on the main results and conclusion. - Restate the key result. - State the main conclusion. Be clear about why results support this conclusion. Maintain connection with purpose of the study. Interpret in context of literature. - Present/compare with results of and methods used in other studies on same/similar topics. - Emphasize strengths of study and what is new/useful. State limitations/caveats (frankly, without apology). Make recommendations. - changes in practice/policy - future studies
. Make recommendations. - changes in practice/policy - future studies.")
24
The DISCUSSION Purpose: to interpret your results and justify your interpretation Guidelines for Constructing the Discussion Focus on the main results and conclusion. - Restate the key result. - State the main conclusion. Be clear about why results support this conclusion. Maintain connection with purpose of the study. Interpret in context of literature. - Present/compare with results of and methods used in other studies on same/similar topics. - Emphasize strengths of study and what is new/useful. State limitations/caveats (frankly, without apology). Make recommendations. - changes in practice/policy - future studies: include some specifics (methods/population/setting)
. Make recommendations. - changes in practice/policy - future studies: include some specifics (methods/population/setting).")
25
The DISCUSSION Purpose: to interpret your results and justify your interpretation Guidelines for Constructing the Discussion Focus on the main results and conclusion. - Restate the key result. - State the main conclusion. Be clear about why results support this conclusion. Maintain connection with purpose of the study. Interpret in context of literature. - Present/compare with results of and methods used in other studies on same/similar topics. - Emphasize strengths of study and what is new/useful. State limitations/caveats (frankly, without apology). Make recommendations. - changes in practice/policy - future studies - include some specifics (methods/population/setting) can often be accomplished in four or five paragraphs
. Make recommendations. - changes in practice/policy - future studies - include some specifics (methods/population/setting) can often be accomplished in four or five paragraphs.")
26
Guidelines for Constructing the Discussion Focus on the main results and conclusion. - Restate the key result. - State the main conclusion. Be clear about why results support this conclusion. Maintain connection with purpose of the study. Interpret in context of literature. - Present/compare with results of and methods used in other studies on same/similar topics. - Emphasize strengths of study and what is new/useful. State limitations/caveats (frankly, without apology). Make recommendations. - changes in practice/policy - future studies - include some specifics (methods/population/setting)
. Make recommendations. - changes in practice/policy - future studies - include some specifics (methods/population/setting).")
27
DISCUSSION The analysis of alcohol-related crash rates clearly demonstrates a rise in both alcohol-related crashes and alcohol-related crash fatalities occurring between noon on Sunday and noon on Monday, after the ban on Sunday packaged alcohol sales was lifted. The 29% increase in Sunday alcohol-related crash rates resulted in an estimated excess of 543.1 alcohol-related motor vehicle crashes between July 1, 1995, and June 30, 2000, over what would have been observed had the ban not been repealed. There was a 42% pre- to postrepeal increase in the Sunday alcohol-related crash fatality rate, resulting in an excess of 41.6 fatalities attributable to repealing the ban on Sunday packaged alcohol sales (95% CI= 6.6, 76.6). No other day of the week showed any statistically significant change in alcohol-related crashes or alcohol-related crash fatalities. Furthermore, the analysis of non–alcohol-related crash rates indicates that relative crash rates on Sundays cannot be attributed to background trends in crash risks. Some limitations are apparent. The reporting police officer classified nonfatal crashes as alcohol involved or not alcohol involved. There has been some debate about the accuracy of such reporting 23,24 because the designation often relies on the subjective judgment of the reporting police officer. Some researchers have suggested that investigators use single-vehicle nighttime crashes as a proxy measure of alcohol-related crashes and alcohol-related crash fatalities. 25 This tactic, however, did not allow us to estimate the true impact of repealing the ban on the number of alcohol-related crashes and alcohol-related crash fatalities (Table 2), which is of primary concern to state legislators. The issue is of less concern, however, because it has been shown that police-reported rates of alcohol involvement and rates of single-vehicle nighttime crashes tend to be highly correlated. 26 Furthermore, a recent study using the New Mexico crash data to investigate drive-up liquor window closure on crash rates in New Mexico found no difference in any results whether one considered single-vehicle nighttime or all alcohol-related crashes. 20 Analyses of driving-while-impaired citation data would help corroborate our findings. Moreover, there is no reason to believe that an error in police officer reporting would be biased only on Sundays and only after the ban on Sunday packaged alcohol sales was lifted. Even so, this limitation does not apply to fatal crash results for which alcohol involvement was determined by blood alcohol concentration. Our results strongly suggest that increasing alcohol availability on Sunday was associated with increases in alcohol-related motor vehicle crashes and fatalities. Legalizing Sunday packaged alcohol sales may increase state tax revenues, but at the same time it exacts a significant price that is paid by crash victims and their loved ones, health care providers, insurers, and law enforcement and judicial systems. State legislators should consider these consequences when deciding on policy that is intended to serve the public well-being.
. No other day of the week showed any statistically significant change in alcohol-related crashes or alcohol-related crash fatalities. Furthermore, the analysis of non–alcohol-related crash rates indicates that relative crash rates on Sundays cannot be attributed to background trends in crash risks. Some limitations are apparent. The reporting police officer classified nonfatal crashes as alcohol involved or not alcohol involved. There has been some debate about the accuracy of such reporting 23,24 because the designation often relies on the subjective judgment of the reporting police officer. Some researchers have suggested that investigators use single-vehicle nighttime crashes as a proxy measure of alcohol-related crashes and alcohol-related crash fatalities. 25 This tactic, however, did not allow us to estimate the true impact of repealing the ban on the number of alcohol-related crashes and alcohol-related crash fatalities (Table 2), which is of primary concern to state legislators. The issue is of less concern, however, because it has been shown that police-reported rates of alcohol involvement and rates of single-vehicle nighttime crashes tend to be highly correlated. 26 Furthermore, a recent study using the New Mexico crash data to investigate drive-up liquor window closure on crash rates in New Mexico found no difference in any results whether one considered single-vehicle nighttime or all alcohol-related crashes. 20 Analyses of driving-while-impaired citation data would help corroborate our findings. Moreover, there is no reason to believe that an error in police officer reporting would be biased only on Sundays and only after the ban on Sunday packaged alcohol sales was lifted. Even so, this limitation does not apply to fatal crash results for which alcohol involvement was determined by blood alcohol concentration. Our results strongly suggest that increasing alcohol availability on Sunday was associated with increases in alcohol-related motor vehicle crashes and fatalities. Legalizing Sunday packaged alcohol sales may increase state tax revenues, but at the same time it exacts a significant price that is paid by crash victims and their loved ones, health care providers, insurers, and law enforcement and judicial systems. State legislators should consider these consequences when deciding on policy that is intended to serve the public well-being..")
28
DISCUSSION The analysis of alcohol-related crash rates clearly demonstrates a rise in both alcohol-related crashes and alcohol-related crash fatalities occurring between noon on Sunday and noon on Monday, after the ban on Sunday packaged alcohol sales was lifted. The 29% increase in Sunday alcohol-related crash rates resulted in an estimated excess of 543.1 alcohol-related motor vehicle crashes between July 1, 1995, and June 30, 2000, over what would have been observed had the ban not been repealed. There was a 42% pre- to postrepeal increase in the Sunday alcohol-related crash fatality rate, resulting in an excess of 41.6 fatalities attributable to repealing the ban on Sunday packaged alcohol sales (95% CI= 6.6, 76.6). No other day of the week showed any statistically significant change in alcohol-related crashes or alcohol-related crash fatalities. Furthermore, the analysis of non–alcohol-related crash rates indicates that relative crash rates on Sundays cannot be attributed to background trends in crash risks. Some limitations are apparent. The reporting police officer classified nonfatal crashes as alcohol involved or not alcohol involved. There has been some debate about the accuracy of such reporting because the designation often relies on the subjective judgment of the reporting police officer. Some researchers have suggested that investigators use single-vehicle nighttime crashes as a proxy measure of alcohol-related crashes and alcohol-related crash fatalities. This tactic, however, did not allow us to estimate the true impact of repealing the ban on the number of alcohol-related crashes and alcohol-related crash fatalities (Table 2), which is of primary concern to state legislators. The issue is of less concern, however, because it has been shown that police- reported rates of alcohol involvement and rates of single-vehicle nighttime crashes tend to be highly correlated. Furthermore, a recent study using the New Mexico crash data to investigate drive-up liquor window closure on crash rates in New Mexico found no difference in any results whether one considered single-vehicle nighttime or all alcohol-related crashes. Analyses of driving-while-impaired citation data would help corroborate our findings. Moreover, there is no reason to believe that an error in police officer reporting would be biased only on Sundays and only after the ban on Sunday packaged alcohol sales was lifted. Even so, this limitation does not apply to fatal crash results for which alcohol involvement was determined by blood alcohol concentration. Our results strongly suggest that increasing alcohol availability on Sunday was associated with increases in alcohol-related motor vehicle crashes and fatalities. Legalizing Sunday packaged alcohol sales may increase state tax revenues, but at the same time it exacts a significant price that is paid by crash victims and their loved ones, health care providers, insurers, and law enforcement and judicial systems. State legislators should consider these consequences when deciding on policy that is intended to serve the public well-being. = ¶ 1 (main result/conclusion) = ¶ 2+3 (limitations/compare to other studies) ?
. No other day of the week showed any statistically significant change in alcohol-related crashes or alcohol-related crash fatalities. Furthermore, the analysis of non–alcohol-related crash rates indicates that relative crash rates on Sundays cannot be attributed to background trends in crash risks. Some limitations are apparent. The reporting police officer classified nonfatal crashes as alcohol involved or not alcohol involved. There has been some debate about the accuracy of such reporting because the designation often relies on the subjective judgment of the reporting police officer. Some researchers have suggested that investigators use single-vehicle nighttime crashes as a proxy measure of alcohol-related crashes and alcohol-related crash fatalities. This tactic, however, did not allow us to estimate the true impact of repealing the ban on the number of alcohol-related crashes and alcohol-related crash fatalities (Table 2), which is of primary concern to state legislators. The issue is of less concern, however, because it has been shown that police- reported rates of alcohol involvement and rates of single-vehicle nighttime crashes tend to be highly correlated. Furthermore, a recent study using the New Mexico crash data to investigate drive-up liquor window closure on crash rates in New Mexico found no difference in any results whether one considered single-vehicle nighttime or all alcohol-related crashes. Analyses of driving-while-impaired citation data would help corroborate our findings. Moreover, there is no reason to believe that an error in police officer reporting would be biased only on Sundays and only after the ban on Sunday packaged alcohol sales was lifted. Even so, this limitation does not apply to fatal crash results for which alcohol involvement was determined by blood alcohol concentration. Our results strongly suggest that increasing alcohol availability on Sunday was associated with increases in alcohol-related motor vehicle crashes and fatalities. Legalizing Sunday packaged alcohol sales may increase state tax revenues, but at the same time it exacts a significant price that is paid by crash victims and their loved ones, health care providers, insurers, and law enforcement and judicial systems. State legislators should consider these consequences when deciding on policy that is intended to serve the public well-being. = ¶ 1 (main result/conclusion) = ¶ 2+3 (limitations/compare to other studies) .")
29
Our results strongly suggest that increasing alcohol availability on Sunday was associated with increases in alcohol-related motor vehicle crashes and fatalities. Legalizing Sunday packaged alcohol sales may increase state tax revenues, but at the same time it exacts a significant price that is paid by crash victims and their loved ones, health care providers, insurers, and law enforcement and judicial systems. State legislators should consider these consequences when deciding on policy that is intended to serve the public well-being. RECOMMENDATION MAIN CONCLUSION (restated) Additional Context
 Additional Context.")
30
Legalized Sunday Packaged Alcohol Sales and Alcohol Related Traffic Crashes and Crash Fatalities in New Mexico We determined the relative risk of alcohol-related motor vehicle accidents and fatalities after New Mexico lifted its ban on Sunday packaged alcohol sales. We extracted all alcohol-related crashes from New Mexico police reports for 3652 days between July 1, 1990, and June 30, 2000, and found a 29% increase in alcohol-related crashes and a 42% increase in alcohol-related crash fatalities on Sundays after the ban on Sunday packaged alcohol sales was lifted. There was an estimated excess of 543.1 alcohol-related crashes and 41.6 alcohol-related crash fatalities on Sundays after the ban was lifted. Repealing the ban on Sunday packaged alcohol sales introduced a public health and safety hazard in New Mexico. Editing for SUBSTANCE Mistakes Ambiguity Missing key info Extraneous/misleading info

31
Legalized Sunday Packaged Alcohol Sales and Alcohol Related Traffic Crashes and Crash Fatalities in New Mexico We determined the relative risk of alcohol-related motor vehicle accidents and fatalities after New Mexico lifted its ban on Sunday packaged alcohol sales. We extracted all alcohol-related crashes from New Mexico police reports for 3652 days between July 1, 1990, and June 30, 2000, and found a 29% increase in alcohol-related crashes and a 42% increase in alcohol-related crash fatalities on Sundays after the ban on Sunday packaged alcohol sales was lifted. There was an estimated excess of 543.1 alcohol-related crashes and 41.6 alcohol-related crash fatalities on Sundays after the ban was lifted. Repealing the ban on Sunday packaged alcohol sales introduced a public health and safety hazard in New Mexico. Editing for SUBSTANCE Mistakes Ambiguity Missing key info Extraneous/misleading info

32
Legalized Sunday Packaged Alcohol Sales and Alcohol Related Traffic Crashes and Crash Fatalities in New Mexico We determined the relative risk of alcohol-related motor vehicle accidents and fatalities after New Mexico lifted its ban on Sunday packaged alcohol sales on July 1, 1995. We extracted all alcohol-related crashes from New Mexico police reports for 3652 days between July 1, 1990, and June 30, 2000, and found a 29% increase in alcohol-related crashes and a 42% increase in alcohol-related crash fatalities on Sundays after the ban on Sunday packaged alcohol sales was lifted. There was an estimated excess of 543.1 alcohol-related crashes and 41.6 alcohol-related crash fatalities on Sundays after the ban was lifted. Repealing the ban on Sunday packaged alcohol sales introduced a public health and safety hazard in New Mexico.

33
Excess or Reduction (95% Confidence Interval) Alcohol-Related CrashAlcohol-Related Crash Fatality Sunday 543.1 (158.9, 927.4)41.6 (6.6, 76.6) Monday -5.8 (-392.1, 380.5)3.1 (-29.7, 35.9) Tuesday 184.5 (-199.2, 568.2)13.9 (-15.6, 43.3) Wednesday -67.1 (-514.2, 380.0)4.5 (-28.2, 37.2) Thursday 121.7 (-355.7, 599.1)9.9 (-26.4, 46.1) Friday-117.9 (-1003.2, 767.3)8.0 (-46.6, 62.6) Saturday 89.9 (-764.6, 944.5)17.2 (-41.4, 75.8)
 Alcohol-Related CrashAlcohol-Related Crash Fatality Sunday (158.9, 927.4)41.6 (6.6, 76.6) Monday -5.8 (-392.1, 380.5)3.1 (-29.7, 35.9) Tuesday (-199.2, 568.2)13.9 (-15.6, 43.3) Wednesday (-514.2, 380.0)4.5 (-28.2, 37.2) Thursday (-355.7, 599.1)9.9 (-26.4, 46.1) Friday ( , 767.3)8.0 (-46.6, 62.6) Saturday 89.9 (-764.6, 944.5)17.2 (-41.4, 75.8)")
34
Excess or Reduction (95% Confidence Interval) Alcohol-Related CrashAlcohol-Related Crash Fatality Sunday 543 (159, 927)42 (7, 77) Monday -6 (-392, 380)3 (-30, 36) Tuesday 185 (-199, 568)14 (-16, 43) Wednesday -67 (-514, 380)5 (-28, 37) Thursday 121 (-356, 599)10 (-26, 46) Friday-118 (-1003, 767)8 (-47, 63) Saturday 90 (-765, 945)17 (-41, 76)
 Alcohol-Related CrashAlcohol-Related Crash Fatality Sunday 543 (159, 927)42 (7, 77) Monday -6 (-392, 380)3 (-30, 36) Tuesday 185 (-199, 568)14 (-16, 43) Wednesday -67 (-514, 380)5 (-28, 37) Thursday 121 (-356, 599)10 (-26, 46) Friday-118 (-1003, 767)8 (-47, 63) Saturday 90 (-765, 945)17 (-41, 76)")
36
Study Purpose % smokers among pregnant women % smokers among non-pregnant women compare to 50%

38
R1R1 ↓ C1C1... R2R2 ↓ C2C2 R 1 + R 2 ↓ C 1 + C 2

39
R 1 + R 2 ↓ C 1

40
Structured Discussion – BMJ Suggested structure for discussion of scientific papers Statement of principal findings Strengths and weaknesses of the study Strengths and weaknesses in relation to other studies, discussing particularly any differences in results Meaning of the study: possible mechanisms and implications for clinicians or policymakers Unanswered questions and future research

41
Other resources to help you write better papers Observational studies – STROBE Clinical trials – CONSORT Diagnostic studies – STARD Meta-analysis – QUOROM

42
STROBE Statement

44
The true number of examinations for oral cancer is probably far below the national objective of 40%. An unknown number of clinicians may not conduct oral examinations routinely or when patient behaviors indicate one.

46
Author conjecture

48
The true number of examinations for oral cancer is probably far below the national objective of 40%. An unknown number of clinicians may not conduct oral examinations routinely or when patient behaviors indicate one.

49
'When I use a word,' Humpty Dumpty said, ‘it means just what I choose it to mean ‑‑ neither more nor less.' 'The question is,' said Alice, 'whether you can make words mean so many different things.' 'The question is,' said Humpty Dumpty, 'which is to be master ‑‑ that's all.' Alice was too much puzzled to say anything.

50
The RESULTS

51
Purpose: to describe the results of data analysis that are relevant to the study purpose

52
The RESULTS Purpose: to describe the results of data analysis that are relevant to the study purpose

53
The RESULTS Purpose: to describe the results of data analysis that are relevant to the study purpose ● Start with tables and figures. Write the text later.

54
Tables/Figures

55
Use tables to highlight individual values. Use figures to highlight trends/relationships. Check your math. Provide consistent row or column summation. Keep lines to a minimum; avoid vertical lines. Use footnotes to clarify points of potential ambiguity. Check heading, labels of rows/columns/axes, and footnotes.

56
Tables/Figures Use tables to highlight individual values. Use figures to highlight trends/relationships. Check your math. Provide consistent row or column summation. Keep lines to a minimum; avoid vertical lines. Use footnotes to clarify points of potential ambiguity. Check heading, labels of rows/columns/axes, and footnotes.

59
Tables/Figures Use tables to highlight individual values. Use figures to highlight trends/relationships. Check your math. Provide consistent row or column summation. Keep lines to a minimum; avoid vertical lines. Use footnotes to clarify points of potential ambiguity. Check heading, labels of rows/columns/axes, and footnotes.

60
Trends in Postpartum Diabetes Screening and Subsequent Diabetes and Impaired Glucose Regulation among Women with Histories of Gestational Diabetes Mellitus “A large number (n= 600) of women with gestational diabetes underwent an oral glucose tolerance test. Of these women, 4 (25%) were diagnosed by fasting plasma glucose alone. Of the remaining 12 women, 8 (50%) had impaired fasting glucose and 4 (25%) had a normal fasting glucose.” When you show percentages, be clear what the denominator is: number AND characteristics
 were diagnosed by fasting plasma glucose alone. Of the remaining 12 women, 8 (50%) had impaired fasting glucose and 4 (25%) had a normal fasting glucose. When you show percentages, be clear what the denominator is: number AND characteristics.")
61
MaleFemaleTotal Exposure GroupNo. (%) IDU*4026 (70)613 (47)4639 (66) With male-male sex 628 (11)--628 (13) Male-male sex1281 (22)--1281 (18) Heterosexual Transmission245 (4) 553 (43)798 (11) Sexual contact with IDU123 (2) 423 (33)546 (8) Blood products97 (2) 87 (7)184 (3) Other/Unknown133 (2) 45 (3)178 (2) TOTAL5782 (100)1298 (100)7080 (100) *IDU: injecting-drug user Can you find the calculation error in this table?
 IDU*4026 (70)613 (47)4639 (66) With male-male sex 628 (11)--628 (13) Male-male sex1281 (22) (18) Heterosexual Transmission245 (4) 553 (43)798 (11) Sexual contact with IDU123 (2) 423 (33)546 (8) Blood products97 (2) 87 (7)184 (3) Other/Unknown133 (2) 45 (3)178 (2) TOTAL5782 (100)1298 (100)7080 (100) *IDU: injecting-drug user Can you find the calculation error in this table .")
62
MaleFemaleTotal Exposure GroupNo. (%) IDU*4026 (70)613 (47)4639 (66) With male-male sex 628 (11)--628 (13) Male-male sex1281 (22)--1281 (18) Heterosexual Transmission245 (4) 553 (43)798 (11) Sexual contact with IDU123 (2) 423 (33)546 (8) Blood products97 (2) 87 (7)184 (3) Other/Unknown133 (2) 45 (3)178 (2) TOTAL5782 (100)1298 (100)7080 (100) *IDU: injecting-drug user
 IDU*4026 (70)613 (47)4639 (66) With male-male sex 628 (11)--628 (13) Male-male sex1281 (22) (18) Heterosexual Transmission245 (4) 553 (43)798 (11) Sexual contact with IDU123 (2) 423 (33)546 (8) Blood products97 (2) 87 (7)184 (3) Other/Unknown133 (2) 45 (3)178 (2) TOTAL5782 (100)1298 (100)7080 (100) *IDU: injecting-drug user.")
63
MaleFemaleTotal Exposure GroupNo. (%) IDU*4026 (70)613 (47)4639 (66) With male-male sex 628 (11)--628 (13) Male-male sex1281 (22)--1281 (18) Heterosexual Transmission245 (4) 553 (43)798 (11) Sexual contact with IDU123 (2) 423 (33)546 (8) Blood products97 (2) 87 (7)184 (3) Other/Unknown133 (2) 45 (3)178 (2) TOTAL5782 (100)1298 (100)7080 (100) *IDU: injecting-drug user 11% -- 628/5782
 IDU*4026 (70)613 (47)4639 (66) With male-male sex 628 (11)--628 (13) Male-male sex1281 (22) (18) Heterosexual Transmission245 (4) 553 (43)798 (11) Sexual contact with IDU123 (2) 423 (33)546 (8) Blood products97 (2) 87 (7)184 (3) Other/Unknown133 (2) 45 (3)178 (2) TOTAL5782 (100)1298 (100)7080 (100) *IDU: injecting-drug user 11% /5782.")
64
MaleFemaleTotal Exposure GroupNo. (%) IDU*4026 (70)613 (47)4639 (66) With male-male sex 628 (11)--628 (13) Male-male sex1281 (22)--1281 (18) Heterosexual Transmission245 (4) 553 (43)798 (11) Sexual contact with IDU123 (2) 423 (33)546 (8) Blood products97 (2) 87 (7)184 (3) Other/Unknown133 (2) 45 (3)178 (2) TOTAL5782 (100)1298 (100)7080 (100) *IDU: injecting-drug user 11% -- 628/5782 13% -- 628/4639
 IDU*4026 (70)613 (47)4639 (66) With male-male sex 628 (11)--628 (13) Male-male sex1281 (22) (18) Heterosexual Transmission245 (4) 553 (43)798 (11) Sexual contact with IDU123 (2) 423 (33)546 (8) Blood products97 (2) 87 (7)184 (3) Other/Unknown133 (2) 45 (3)178 (2) TOTAL5782 (100)1298 (100)7080 (100) *IDU: injecting-drug user 11% / % /4639.")
65
MaleFemaleTotal Exposure GroupNo. (%) IDU*4026 (70)613 (47)4639 (66) With male-male sex 628 (11)--628 (13) Male-male sex1281 (22)--1281 (18) Heterosexual Transmission245 (4) 553 (43)798 (11) Sexual contact with IDU123 (2) 423 (33)546 (8) Blood products97 (2) 87 (7)184 (3) Other/Unknown133 (2) 45 (3)178 (2) TOTAL5782 (100)1298 (100)7080 (100) *IDU: injecting-drug user How do we correct the mistake?
 IDU*4026 (70)613 (47)4639 (66) With male-male sex 628 (11)--628 (13) Male-male sex1281 (22) (18) Heterosexual Transmission245 (4) 553 (43)798 (11) Sexual contact with IDU123 (2) 423 (33)546 (8) Blood products97 (2) 87 (7)184 (3) Other/Unknown133 (2) 45 (3)178 (2) TOTAL5782 (100)1298 (100)7080 (100) *IDU: injecting-drug user How do we correct the mistake .")
66
MaleFemaleTotal Exposure GroupNo. (%) IDU*4026 (70)613 (47)4639 (66) With male-male sex 628 (11)--628 (139) Male-male sex1281 (22)--1281 (18) Heterosexual Transmission245 (4) 553 (43)798 (11) Sexual contact with IDU123 (2) 423 (33)546 (8) Blood products97 (2) 87 (7)184 (3) Other/Unknown133 (2) 45 (3)178 (2) TOTAL5782 (100)1298 (100)7080 (100) *IDU: injecting-drug user 628/7080 = 9%
 IDU*4026 (70)613 (47)4639 (66) With male-male sex 628 (11)--628 (139) Male-male sex1281 (22) (18) Heterosexual Transmission245 (4) 553 (43)798 (11) Sexual contact with IDU123 (2) 423 (33)546 (8) Blood products97 (2) 87 (7)184 (3) Other/Unknown133 (2) 45 (3)178 (2) TOTAL5782 (100)1298 (100)7080 (100) *IDU: injecting-drug user 628/7080 = 9%.")
67
Tables/Figures Use tables to highlight individual values. Use figures to highlight trends/relationships. Check your math. Provide consistent row or column summation. Keep lines to a minimum; avoid vertical lines. Use footnotes to clarify points of potential ambiguity. Check heading, labels of rows/columns/axes, and footnotes.

68
MaleFemaleTotal Exposure GroupNo. (%) IDU*4026 (70)613 (47)4639 (66) Male-male sex1281 (22)--1281 (18) Heterosexual Transmission245 (4) 553 (43)798 (11) Blood products97 (2) 87 (7)184 (3) Other/Unknown133 (2) 45 (3)178 (2) TOTAL5782 (82)1298 (18)7080 (100) *IDU: injecting-drug user
 IDU*4026 (70)613 (47)4639 (66) Male-male sex1281 (22) (18) Heterosexual Transmission245 (4) 553 (43)798 (11) Blood products97 (2) 87 (7)184 (3) Other/Unknown133 (2) 45 (3)178 (2) TOTAL5782 (82)1298 (18)7080 (100) *IDU: injecting-drug user.")
69
MaleFemaleTotal Exposure GroupNo. (%) IDU*4026 (70)613 (47)4639 (66) Male-male sex1281 (22)--1281 (18) Heterosexual Transmission245 (4) 553 (43)798 (11) Blood products97 (2) 87 (7)184 (3) Other/Unknown133 (2) 45 (3)178 (2) TOTAL5782 (82)1298 (18)7080 (100) *IDU: injecting-drug user
 IDU*4026 (70)613 (47)4639 (66) Male-male sex1281 (22) (18) Heterosexual Transmission245 (4) 553 (43)798 (11) Blood products97 (2) 87 (7)184 (3) Other/Unknown133 (2) 45 (3)178 (2) TOTAL5782 (82)1298 (18)7080 (100) *IDU: injecting-drug user.")
70
Tables/Figures Use tables to highlight individual values. Use figures to highlight trends/relationships. Check your math. Provide consistent row or column summation. Keep lines to a minimum; avoid vertical lines. Use footnotes to clarify points of potential ambiguity. Check heading, labels of rows/columns/axes, and footnotes.

71
Table 1Table 1 Percent missing individual data elements, overall and for single and multiple race groups Public Health Rep. 2006 Mar–Apr; 121(2): 160–168. The Role of Reported Primary Race on Health Measures for Multiple Race Respondents in the National Health Interview Survey Jennifer D Parker, PhDa
: 160–168. The Role of Reported Primary Race on Health Measures for Multiple Race Respondents in the National Health Interview Survey Jennifer D Parker, PhDa.")
72
AJPH August 2008, 1460 Vol 98, No. 8 Leisure-Time Physical Activity Disparities Among Hispanic Subgroups in the United States Charles J. Neighbors, PhD, MBA, David X. Marquez, PhD, and Bess H. Marcus, PhD

73
Tables/Figures Use tables to highlight individual values. Use figures to highlight trends/relationships. Check your math. Provide consistent row or column summation. Keep lines to a minimum; avoid vertical lines. Use footnotes to clarify points of potential ambiguity. Check heading, labels of rows/columns/axes, and footnotes.

74
MaleFemaleTotal Exposure GroupNo. (%) IDU*4026 (70)613 (47)4639 (66) Male-male sex1281 (22)--1281 (18) Heterosexual Transmission245 (4) 553 (43)798 (11) Blood products97 (2) 87 (7)184 (3) Other/Unknown133 (2) 45 (3)178 (2) TOTAL5782 (82)1298 (18)7080 (100) *IDU: injecting-drug user Footnotes
 IDU*4026 (70)613 (47)4639 (66) Male-male sex1281 (22) (18) Heterosexual Transmission245 (4) 553 (43)798 (11) Blood products97 (2) 87 (7)184 (3) Other/Unknown133 (2) 45 (3)178 (2) TOTAL5782 (82)1298 (18)7080 (100) *IDU: injecting-drug user Footnotes.")
75
Note. Sample size totals vary owing to question- specific nonresponse a. Includes 44 states and the District of Columbia b. Three or more sessions per week, 20 or more minutes per session. c. Fewer than three sessions per week and/or less than 20 minutes per session. d. Persons who report having participated during the past month in any leisure-time physical activities or exercises such as running, calisthenics, golf, gardening, or walking e. Relative prevalence of walking = prevalence of walking divided by prevalence of participation in at least one activity f. Standard error of the mean g. See “Methods” section for definition of body mass categories

76
Tables/Figures Use tables to highlight individual values. Use figures to highlight trends/relationships. Check your math. Provide consistent row or column summation. Keep lines to a minimum; avoid vertical lines. Use footnotes to clarify points of potential ambiguity. Check heading, labels of rows/columns/axes, and footnotes.

77
Table 2. Exposure groups among adults by gender. EXPOSURE GROUP ADULT MALEADULT FEMALETOTAL IDU*4026 (70%)613 (47%)4639(66%) [Male-male sex + IDU] [628/4026 = 16%] 0[628/4639= 13%] MALE-MALE SEX1281 (22%)01281 (18%) HETEROSEXUAL TRANSMISSION 245 (4%)553 (43%)798(11%) [Heterosexual Transmission through contact with an injecting- drug user] [123/245= 50%][423/553= 76%][546/798= 68%] BLOOD PRODUCTS 97 (2%)87 (7%)201 (3%) OTHER/ UNKNOWN 133 (2%)45 (3%)178 (2%) TOTAL5782 (82%)1298 (18%)7080 *IDU: injecting-drug user
613 (47%)4639(66%) [Male-male sex + IDU] [628/4026 = 16%] 0[628/4639= 13%] MALE-MALE SEX1281 (22%)01281 (18%) HETEROSEXUAL TRANSMISSION 245 (4%)553 (43%)798(11%) [Heterosexual Transmission through contact with an injecting- drug user] [123/245= 50%][423/553= 76%][546/798= 68%] BLOOD PRODUCTS 97 (2%)87 (7%)201 (3%) OTHER/ UNKNOWN 133 (2%)45 (3%)178 (2%) TOTAL5782 (82%)1298 (18%)7080 *IDU: injecting-drug user.")
78
Table 2. Adult AIDS cases, by exposure group and sex, Puerto Rico, 1981-1991. MaleFemaleTotal Exposure GroupNo. (%) IDU*4026 (70)613 (47)4639 (66) With male-male sex 628 (11)--628 (9) Male-male sex1281 (22)--1281 (18) Heterosexual Transmission245 (4) 553 (43)798 (11) Sexual contact with IDU123 (2) 423 (33)546 (8) Blood products97 (2) 87 (7)184 (3) Other/Unknown133 (2) 45 (3)178 (2) TOTAL5782 (100)1298 (100)7080 (100) *IDU: injecting-drug user Remember: minimum number of lines no vertical lines Do you see any shortcomings in this improved table?
 IDU*4026 (70)613 (47)4639 (66) With male-male sex 628 (11)--628 (9) Male-male sex1281 (22) (18) Heterosexual Transmission245 (4) 553 (43)798 (11) Sexual contact with IDU123 (2) 423 (33)546 (8) Blood products97 (2) 87 (7)184 (3) Other/Unknown133 (2) 45 (3)178 (2) TOTAL5782 (100)1298 (100)7080 (100) *IDU: injecting-drug user Remember: minimum number of lines no vertical lines Do you see any shortcomings in this improved table .")
79
Table 2. Adult AIDS cases, by exposure group and sex, Puerto Rico, 1981-1991 MaleFemaleTotal Exposure Group No. (%) IDU*3398 (59)613 (47)4011 (57) MSM**1281 (22)--1281 (18) IDU + MSM 628 (11)--628 (9) Heterosexual Transmission122 (2) 130 (10)252 (3) Heterosexual Transmission + sexual contact with IDU 123 (2) 423 (33)546 (8) Blood products97 (2) 87 (7)184 (3) Other/Unknown133 (2) 45 (3)178 (2) TOTAL5782 (100)1298 (100)7080 (100) *IDU: Injecting-drug user ** MSM: Men who have sex with men
 IDU*3398 (59)613 (47)4011 (57) MSM**1281 (22) (18) IDU + MSM 628 (11)--628 (9) Heterosexual Transmission122 (2) 130 (10)252 (3) Heterosexual Transmission + sexual contact with IDU 123 (2) 423 (33)546 (8) Blood products97 (2) 87 (7)184 (3) Other/Unknown133 (2) 45 (3)178 (2) TOTAL5782 (100)1298 (100)7080 (100) *IDU: Injecting-drug user ** MSM: Men who have sex with men.")
80
Table 2. Adult AIDS cases, by exposure group and sex, Puerto Rico, 1981-1991 Male (n=5782) Female (n=1298) Total (n=7080) Exposure Group%% IDU*594757 MSM**22--18 IDU + MSM 11--9 Heterosexual Transmission2 103 Heterosexual Transmission + sexual contact with IDU 2 338 Blood products2 73 Other/Unknown2 32 * IDU: Injecting-drug user ** MSM: Men who have sex with men
 Female (n=1298) Total (n=7080) Exposure Group%% IDU* MSM** IDU + MSM Heterosexual Transmission2 103 Heterosexual Transmission + sexual contact with IDU Blood products2 73 Other/Unknown2 32 * IDU: Injecting-drug user ** MSM: Men who have sex with men.")
81
The RESULTS Purpose: to describe the results of data analysis that are relevant to the study purpose ● Start with tables and figures. Write the text later. ● Text supplements/reinforces tables and figures.

82
Text Summarize/emphasize highlights. Be brief: a picture (table/figure) is worth a thousand words. Fill in gaps. Make sure text is consistent with tables/figures.

83
Text Summarize/emphasize highlights. Be brief: a picture (table/figure) is worth a thousand words. Fill in gaps. Make sure text is consistent with tables/figures.

84
Text Summarize/emphasize highlights. Be brief: a picture (table/figure) is worth a thousand words. Fill in gaps. Make sure text is consistent with tables/figures.

86
# of people who began smoking during the relevant year # of non-smoking people at the beginning of the relevant year Smoking initiation rate:

87
During 1980 to 1989, the smoking initiation rate increased for adolescents and decreased for young adults, resulting in a large disparity in initiation rates between the two groups. In 1982, smoking initiation rates among young adults and adolescents were similar, however between 1982-84, significant changes began occurring, resulting in increased smoking initiation rates among adolescents and decreased rates with young adults. Beginning in 1980, over the next 5 years smoking initiation rates among adolescents and young adults decreased slightly and then over the subsequent 5 years, rates for adolescents increased while rates for young adults declined.

88
Smoking initiation rates were similar among adolescents and young adults from 1980 through 1984; from 1984 through 1989 rates increased among adolescents and decreased among young adults, (Fig). S&W rule #5, p5

89
Smoking initiation rates were similar among adolescents and young adults from 1980 through 1984; from 1984 through 1989 rates increased among adolescents and decreased among young adults, (Fig). Smoking initiation rates were similar among adolescents and young adults from 1980 through 1984 (4.8-5.5% vs 4.4-5.1%); from 1984 through 1989 rates increased among adolescents and decreased among young adults, (Fig). Smoking initiation rates were similar among adolescents and young adults from 1980 through 1984 (4.8-5.5% vs 4.4-5.1%); from 1984 through 1989 rates increased among adolescents and decreased among young adults, (Fig). In 1988 and 1989 the smoking initiation rate among adolescents was about two percentage points higher than among young adults.
; from 1984 through 1989 rates increased among adolescents and decreased among young adults, (Fig). Smoking initiation rates were similar among adolescents and young adults from 1980 through 1984 ( % vs %); from 1984 through 1989 rates increased among adolescents and decreased among young adults, (Fig). In 1988 and 1989 the smoking initiation rate among adolescents was about two percentage points higher than among young adults..")
90
Table 1. Age-Adjusted Prevalence of Overall and Walking Leisure-Time Physical Activity (LTPA) among Adults Sample Size Any LTPA 1 % (CI) Total Walking % (CI) Relative Walking 2 % (CI) Total 14470 63.8(62.0-65.6)34.4(32.9-35.9)54.5(53.2-55.9) Age 20-29277472.2(69.9-74.5)31.0(29.4-32.6)43.0(40.9-45.1) 30-39252966.5(64.0-69.1)32.8(30.4-35.2)49.3(46.5-52.1) 40-49242166.2(63.7-68.6)36.2(33.6-38.7)54.7(51.5-57.8) 50-59180863.0(59.2-66.7)38.9(35.0-42.8)61.8(57.8-65.7) 60-69217956.7(53.6-59.7)37.1(34.5-39.7)65.4(62.0-68.9) 70-79158453.4(49.8-57.0)33.4(30.7-36.2)62.6(59.0-66.2) 80+117540.5(36.5-44.5)25.2(21.1-29.4)62.3(55.2-69.4) Gender Male688266.2(64.2-68.2)30.1(28.6-31.6)46.1(44.4-47.9) Female758861.7(59.7-63.7)38.6(36.6-40.6)63.0(61.0-64.9) Race/Ethnicity White732168.7(66.5-70.9)38.1(36.3-39.9)56.0(54.4-57.6) Black280149.8(47.5-52.2)25.2(23.1-27.3)52.0(48.6-55.5) Hispanic324347.1(44.1-50.2)20.2(18.0-22.4)43.6(41.0-46.2) Other Race110555.7(50.6-60.8)28.3(23.6-33.1)52.2(46.5-58.0) 1Participate in any leisure-time physical activity. 2Proportion Any LTPA adults who walk in leisure-time
 among Adults Sample Size Any LTPA 1 % (CI) Total Walking % (CI) Relative Walking 2 % (CI) Total ( )34.4( )54.5( ) Age ( )31.0( )43.0( ) ( )32.8( )49.3( ) ( )36.2( )54.7( ) ( )38.9( )61.8( ) ( )37.1( )65.4( ) ( )33.4( )62.6( ) ( )25.2( )62.3( ) Gender Male ( )30.1( )46.1( ) Female ( )38.6( )63.0( ) Race/Ethnicity White ( )38.1( )56.0( ) Black ( )25.2( )52.0( ) Hispanic ( )20.2( )43.6( ) Other Race ( )28.3( )52.2( ) 1Participate in any leisure-time physical activity. 2Proportion Any LTPA adults who walk in leisure-time.")
91
Table 1. Age-Adjusted Prevalence of Overall and Walking Leisure-Time Physical Activity (LTPA) among Adults Sample Size Any LTPA 1 % (CI) Total Walking % (CI) Relative Walking 2 % (CI) Total 14470 63.8(62.0-65.6)34.4(32.9-35.9)54.5(53.2-55.9) Age 20-29277472.2(69.9-74.5)31.0(29.4-32.6) 43.0(40.9-45.1) 30-39252966.5(64.0-69.1)32.8(30.4-35.2) 49.3(46.5-52.1) 40-49242166.2(63.7-68.6)36.2(33.6-38.7) 54.7(51.5-57.8) 50-59180863.0(59.2-66.7)38.9(35.0-42.8) 61.8(57.8-65.7) 60-69217956.7(53.6-59.7)37.1(34.5-39.7) 65.4(62.0-68.9) 70-79158453.4(49.8-57.0)33.4(30.7-36.2) 62.6(59.0-66.2) 80+117540.5(36.5-44.5)25.2(21.1-29.4) 62.3(55.2-69.4) Gender Male688266.2(64.2-68.2)30.1(28.6-31.6)46.1(44.4-47.9) Female758861.7(59.7-63.7)38.6(36.6-40.6)63.0(61.0-64.9) Race/Ethnicity White732168.7(66.5-70.9)38.1(36.3-39.9)56.0(54.4-57.6) Black280149.8(47.5-52.2)25.2(23.1-27.3)52.0(48.6-55.5) Hispanic324347.1(44.1-50.2)20.2(18.0-22.4)43.6(41.0-46.2) Other Race110555.7(50.6-60.8)28.3(23.6-33.1)52.2(46.5-58.0) The importance of walking relative to all LTPAs increased from a low of 43.0% in the youngest age-group (20-29 years) to a high of 62.3% in the oldest age-group (80 and older).
 among Adults Sample Size Any LTPA 1 % (CI) Total Walking % (CI) Relative Walking 2 % (CI) Total ( )34.4( )54.5( ) Age ( )31.0( ) 43.0( ) ( )32.8( ) 49.3( ) ( )36.2( ) 54.7( ) ( )38.9( ) 61.8( ) ( )37.1( ) 65.4( ) ( )33.4( ) 62.6( ) ( )25.2( ) 62.3( ) Gender Male ( )30.1( )46.1( ) Female ( )38.6( )63.0( ) Race/Ethnicity White ( )38.1( )56.0( ) Black ( )25.2( )52.0( ) Hispanic ( )20.2( )43.6( ) Other Race ( )28.3( )52.2( ) The importance of walking relative to all LTPAs increased from a low of 43.0% in the youngest age-group (20-29 years) to a high of 62.3% in the oldest age-group (80 and older)..")
92
Text Summarize/emphasize highlights. Be brief: a picture (table/figure) is worth a thousand words. Fill in gaps. Make sure text is consistent with tables/figures.

93
Text Summarize/emphasize highlights. Be brief: a picture (table/figure) is worth a thousand words. Fill in gaps. Make sure text is consistent with tables/figures.

94
Table 1. Age-Adjusted Prevalence of Overall and Walking Leisure-Time Physical Activity (LTPA) among Adults Sample Size Any LTPA 1 % (CI) Total Walking % (CI) Relative Walking 2 % (CI) Total 14470 63.8(62.0-65.6)34.4(32.9-35.9)54.5(53.2-55.9) Age 20-29277472.2(69.9-74.5)31.0(29.4-32.6) 43.0(40.9-45.1) 30-39252966.5(64.0-69.1)32.8(30.4-35.2) 49.3(46.5-52.1) 40-49242166.2(63.7-68.6)36.2(33.6-38.7) 54.7(51.5-57.8) 50-59180863.0(59.2-66.7)38.9(35.0-42.8) 61.8(57.8-65.7) 60-69217956.7(53.6-59.7)37.1(34.5-39.7) 65.4(62.0-68.9) 70-79158453.4(49.8-57.0)33.4(30.7-36.2) 62.6(59.0-66.2) 80+117540.5(36.5-44.5)25.2(21.1-29.4) 62.3(55.2-69.4) Gender Male688266.2(64.2-68.2)30.1(28.6-31.6)46.1(44.4-47.9) Female758861.7(59.7-63.7)38.6(36.6-40.6)63.0(61.0-64.9) Race/Ethnicity White732168.7(66.5-70.9)38.1(36.3-39.9)56.0(54.4-57.6) Black280149.8(47.5-52.2)25.2(23.1-27.3)52.0(48.6-55.5) Hispanic324347.1(44.1-50.2)20.2(18.0-22.4)43.6(41.0-46.2) Other Race110555.7(50.6-60.8)28.3(23.6-33.1)52.2(46.5-58.0) The importance of walking relative to all LTPAs increased from a low of 43.0% in the youngest age-group (20-29 years) to a high of 62.3% in the oldest age-group (80 and older).
 among Adults Sample Size Any LTPA 1 % (CI) Total Walking % (CI) Relative Walking 2 % (CI) Total ( )34.4( )54.5( ) Age ( )31.0( ) 43.0( ) ( )32.8( ) 49.3( ) ( )36.2( ) 54.7( ) ( )38.9( ) 61.8( ) ( )37.1( ) 65.4( ) ( )33.4( ) 62.6( ) ( )25.2( ) 62.3( ) Gender Male ( )30.1( )46.1( ) Female ( )38.6( )63.0( ) Race/Ethnicity White ( )38.1( )56.0( ) Black ( )25.2( )52.0( ) Hispanic ( )20.2( )43.6( ) Other Race ( )28.3( )52.2( ) The importance of walking relative to all LTPAs increased from a low of 43.0% in the youngest age-group (20-29 years) to a high of 62.3% in the oldest age-group (80 and older)..")
98
Text Summarize/emphasize highlights. Be brief: a picture (table/figure) is worth a thousand words. Fill in gaps. Make sure text is consistent with tables/figures. Remember that readers aren’t mind readers.

99
Adolescents (aged 13-19 years) and young adults (aged 20-29 years) accounted for 25% and 27% of heterosexual ‑ contact cases reported in 1992 and 1993, respectively.
 and young adults (aged years) accounted for 25% and 27% of heterosexual ‑ contact cases reported in 1992 and 1993, respectively.")
100
1992 1993 13- 29 years 25% 27% 13-19 20-29 1992-1993 25% 27%

101
1992 1993 13- 29 years 25% 27% 13-19 20-29 1992-1993 25% 27%

102
1992 1993 13- 29 years 25% 27% Now let’s try to revise the original text.

103
Adolescents (aged 13-19 years) and young adults (aged 20-29 years) accounted for 25% and 27% of heterosexual ‑ contact cases reported in 1992 and 1993, respectively. Persons aged 13-29 years accounted for 25% and 27% of heterosexual ‑ contact cases reported in 1992 and 1993, respectively.

104
Reader trying to read the author’s mind

105
Persons aged 13-29 years accounted for 25% and 27% of heterosexual ‑ contact cases reported in 1992 and 1993, respectively. “Respectively” – see Strunk and White, p57 Can we revise this sentence without using “respectively”?

106
Persons aged 13-29 years accounted for 25% and 27% of heterosexual ‑ contact cases reported in 1992 and 1993, respectively.

107
Persons aged 13-29 years accounted for 25% and 27% of heterosexual ‑ contact cases reported in 1992 and 1993, respectively. Persons aged 13–29 years accounted for 25% of heterosexual ‑ contact cases reported in 1992 and 27% in 1993.

108
The RESULTS Purpose: to describe the results of data analysis that are relevant to the study purpose ● Start with tables and figures. Write the text later. ● Text supplements/reinforces tables and figures. ● Present results in a logical sequence.

109
Logical Sequence in parallel with methods background data descriptive bivariate multivariable

110
The RESULTS Purpose: to describe the results of data analysis that are relevant to the study purpose ● Start with tables and figures. Write the text later. ● Text supplements/reinforces tables and figures. ● Present results in a logical sequence. ● Describe what you found, not what you did (Methods).
..")
111
Results (Excerpt: Neonatal Intensive Care Nurse Stressors: An American Study) The highest ratings for selected stressor items on a five-point scale (0-4) were floating out of the unit (3.38; SD=1.02; n=53), unnecessary prolongation of life (3.10; SD=1.27; n=51), emergencies/arrests (3.07; SD=1.03; n=57), and inadequate staffing (3.04; SD=1.04; n=56).
 The highest ratings for selected stressor items on a five-point scale (0-4) were floating out of the unit (3.38; SD=1.02; n=53), unnecessary prolongation of life (3.10; SD=1.27; n=51), emergencies/arrests (3.07; SD=1.03; n=57), and inadequate staffing (3.04; SD=1.04; n=56).")
112
StressornScoreSD Floating533.381.02 Prolongation513.101.27 Emerg/arrests573.071.03 Inad staffing563.041.04 Xxx...... Yyy...... Zzz......

113
The most stressful factors were floating out of the unit, unnecessary prolongation of life, emergencies/arrests, and inadequate staffing. (S&W, rule 7, p7) The most stressful factors were the following: floating out of the unit, unnecessary prolongation of life, emergencies/arrests, and inadequate staffing. (S&W: Words and Expressions Commonly Misused) “Factor” – “can usually be replaced by something more direct” The most stressful situations were the following: floating out of the unit, unnecessary prolongation of life, emergencies/arrests, and inadequate staffing. NICU nurses identified the following situations as the most stressful: floating out of the unit, unnecessary prolongation of life, emergencies/arrests, and inadequate staffing.
 The most stressful factors were the following: floating out of the unit, unnecessary prolongation of life, emergencies/arrests, and inadequate staffing. (S&W: Words and Expressions Commonly Misused) Factor – can usually be replaced by something more direct The most stressful situations were the following: floating out of the unit, unnecessary prolongation of life, emergencies/arrests, and inadequate staffing. NICU nurses identified the following situations as the most stressful: floating out of the unit, unnecessary prolongation of life, emergencies/arrests, and inadequate staffing..")
114
NICU nurses identified the following situations as the most stressful: floating out of the unit, unnecessary prolongation of life, emergencies/arrests, and inadequate staffing (Table).
.")
115
The RESULTS Purpose: to describe the results of data analysis that are relevant to the study purpose ● Start with tables and figures. Write the text later. ● Text supplements/reinforces tables and figures. ● Present results in a logical sequence. ● Describe what you found, not what you did (Methods). ● Consider logical subsections.
. ● Consider logical subsections..")
116
Risk Factors for Invasive Pneumococcal Disease among Navajo Adults METHODS Setting and Case Ascertainment Participants Data Collection Definitions of Study Variables Statistical Analysis Ethical Considerations RESULTS Characteristics of study subjects Univariable analysis Multivariable analysis

117
The RESULTS Purpose: to describe the results of data analysis that are relevant to the study purpose ● Start with tables and figures. Write the text later. ● Text supplements/reinforces tables and figures. ● Present results in a logical sequence. ● Describe what you found, not what you did (Methods). ● Consider logical subsections (maybe similar to the ones in Methods). ● Look to published articles for potential templates.
. ● Consider logical subsections (maybe similar to the ones in Methods). ● Look to published articles for potential templates..")
118
Soft Drink Consumption and Risk of Developing Cardiometabolic Risk Factors and the Metabolic Syndrome in Middle-Aged Adults in the Community Methods Results Study Sample Measurement of Covariates Assessment of Soft Drink Consumption and Dietary Intake of Other Foods Definition and Components of the Metabolic Syndrome Statistical Analyses Soft Drink Consumption and Prevalence of the Metabolic Syndrome Soft Drink Consumption and Incidence of the Metabolic Syndrome Incidence of Individual Components of Incidence of Individual Components of the Metabolic Syndrome Metabolic Syndrome

119
RESULTS Impact of the Standard Weight Loss Intervention Maintenance Intervention Effects Weight Outcomes BSM Psychological Targets SFM Psychological Targets Child Social Problems as a Moderator of Weight Outcome

120
RESULTS Impact of the Standard Weight Loss Intervention Maintenance Intervention Effects Weight Outcomes Interventions vs. Controls BSM vs SFM ITT Analyses BSM Psychological Targets SFM Psychological Targets Child Social Problems as a Moderator of Weight Outcome

121
The RESULTS Purpose: to describe the results of data analysis that are relevant to the study purpose ● Start with tables and figures. Write the text later. ● Text supplements/reinforces tables and figures. ● Present results in a logical sequence. ● Describe what you found, not what you did (Methods). ● Consider logical subsections (maybe similar to the ones in Methods). ● Look to published articles for potential templates.
. ● Consider logical subsections (maybe similar to the ones in Methods). ● Look to published articles for potential templates..")
122
The RESULTS Purpose: to describe the results of data analysis that are relevant to the study purpose ● Start with tables and figures. Write the text later. ● Text supplements/reinforces tables and figures. ● Present results in a logical sequence. ● Describe what you found, not what you did (Methods). ● Consider subsections similar to the ones in Methods. ● Look to published articles for potential templates. (often requires just three paragraphs + three tables/figures)
. ● Consider subsections similar to the ones in Methods. ● Look to published articles for potential templates. (often requires just three paragraphs + three tables/figures).")
123
When the sins of the Methods section

124
When the sins of the Methods section return to haunt

125
When the sins of the Methods section return to haunt the Results section

126
Reliability of Information on Chronic Disease Risk Factors Collected in the Missouri Behavioral Risk Factor Surveillance System Now how do we answer the question: “Do ‘reliability’ and ‘agreement’ mean the same thing?

127
Preventing Alcohol-Exposed Pregnancies: A Randomized Controlled Trial American Journal of Preventive Medicine 2007:32(1):1-10 Do you think this title provides a brief, informative summary of the article? Do you think the study intervention resulted in a decreased number/rate of alcohol-exposed pregnancies?

129
The ABSTRACT Purpose: to highlight key points from the major sections of the article Component of abstract Abstracted from ● Major purpose of study ● Basic procedures ● Main findings ● Principal conclusions Introduction Methods Results Discussion Emphasize what is new and useful.

130
Editing SUBSTANCE –Mistakes –Ambiguity –Missing key info –Extraneous/misleading info –Empty statements

131
The ABSTRACT Is the conclusion supported by the study results? Is it clear that the study provides new/useful information?

132
The Abstract Purpose Methods Results Conclusions RELIABILITY VALIDITY RELIABILITY FLEXIBILITY UTILITY

133
The Abstract Design Brief Motivational Intervention to reduce risk of AEP

134
The Abstract Design Intervention Brief Motivational Intervention to reduce risk of AEP Info + Br-Mot-Int vs Info only

135
The Abstract Design Intervention Results Brief Motivational Intervention to reduce risk of AEP Info + Br-Mot-Int vs Info only Info + Br-Mot-Int > Info only

136
The Abstract Design Intervention Results Conclusions Brief Motivational Intervention to reduce risk of AEP Info + Br-Mot-Int vs Info only Info + Br-Mot-Int > Info only Brief Motivational Intervention

137
The Abstract Design Intervention Results Conclusions Brief Motivational Intervention to reduce risk of AEP Info + Br-Mot-Int vs Info only Info + Br-Mot-Int > Info only Brief Motivational Intervention

138
ABSTRACT Reducing the risk of AEP TITLE Preventing AEP

139
ABSTRACT Reducing the risk of AEP TITLE Preventing AEP

140
The INTRODUCTION

141
Purpose: to convince the reader that your study will yield knowledge or knowhow that is new and useful

142
Elements of the Introduction GAP G B – Key BACKGROUND to the gap. G U – Why filling the gap will be USEFUL. G L – Key LIMITATION(S) of previous studies responsible for the gap.
 of previous studies responsible for the gap..")
143
Elements of the Introduction GAP G B – Key BACKGROUND to the gap. G U – Why filling the gap will be USEFUL. G L – Key LIMITATION(S) of previous studies responsible for the gap. APPROACH A B – BACKGROUND to the approach (not always necessary) A N – What is NEW about the approach taken in the current study. A L – How does this new approach address the LIMITATIONS of previous studies.
 of previous studies responsible for the gap. APPROACH A B – BACKGROUND to the approach (not always necessary) A N – What is NEW about the approach taken in the current study. A L – How does this new approach address the LIMITATIONS of previous studies..")
144
Exercise Briefly describe what is new about this study.

145
The METHODS

146
Participants Intervention Study Design Outcome Measures Baseline Measures Sample Size Statistical Analysis

147
The METHODS Participants Inclusion criteria were: (1) 18–44 years old; (2) no condition causing infertility (tubal ligation, hysterectomy, menopause, or other reason); (3) not pregnant or planning to become pregnant in the next 9 months; (4) had vaginal intercourse during the previous 3 months (or 3 months before going to jail or residential treatment) with a fertile man (not surgically sterile) without using effective contraception (defined in Outcome Measures); (5) engaged in risky drinking (defined in Outcome Measures)...
 18–44 years old; (2) no condition causing infertility (tubal ligation, hysterectomy, menopause, or other reason); (3) not pregnant or planning to become pregnant in the next 9 months; (4) had vaginal intercourse during the previous 3 months (or 3 months before going to jail or residential treatment) with a fertile man (not surgically sterile) without using effective contraception (defined in Outcome Measures); (5) engaged in risky drinking (defined in Outcome Measures)...")
148
The METHODS Participants Women in jail What is their access to alcohol/sexual activity?

149
The RESULTS

150
No significant differences were found in the sociodemographic and clinical characteristics of the intervention and control groups at baseline (Table 2). page 5

151
The RESULTS 1.Overall, study participants had a mean age of 30 years, were predominately African-American (48%), had never been married (51%), and had annual incomes of <$20,000 (55%). 2.Fifty-six percent met the criteria for alcohol dependence on a DSM-IV checklist. 3.Illicit drug use (>90%) and tobacco smoking (>70%) were highly prevalent in the population. 4.Approximately 30% consumed on average eight drinks per occasion and 36 drinks per week. 5.About one-third reported no contraception use, with the remainder reporting using contraception inconsistently or ineffectively. 6.More than 98% of the women in the intervention group received at least one session, and 63% received all four sessions. 7.On average, they attended 3.2 counseling sessions, and approximately 70% attended a contraception consultation visit. 8.Overall, 71% of participants completed the 9-month follow-up interview. 9.The longitudinal analysis included 665 participants who completed the 3-month follow-up interview, 604 who completed the 6-month follow-up interview, and 593 who completed the 9- month follow-up interview, with approximately equal numbers in treatment and control groups at each of the phases.
 and tobacco smoking (>70%) were highly prevalent in the population. 4.Approximately 30% consumed on average eight drinks per occasion and 36 drinks per week. 5.About one-third reported no contraception use, with the remainder reporting using contraception inconsistently or ineffectively. 6.More than 98% of the women in the intervention group received at least one session, and 63% received all four sessions. 7.On average, they attended 3.2 counseling sessions, and approximately 70% attended a contraception consultation visit. 8.Overall, 71% of participants completed the 9-month follow-up interview. 9.The longitudinal analysis included 665 participants who completed the 3-month follow-up interview, 604 who completed the 6-month follow-up interview, and 593 who completed the 9- month follow-up interview, with approximately equal numbers in treatment and control groups at each of the phases..")
154
(n=665) (n=604) (n=593)
 (n=604) (n=593)")
155
The longitudinal analysis included 665 participants who completed the 3-month follow-up interview, 604 who completed the 6-month follow-up interview, and 593 who completed the 9-month follow-up interview, with approximately equal numbers in treatment and control groups at each of the phases (Table 4).
.")
156
The RESULTS The average number of binge-drinking episodes in the intervention group was reduced from 30.1 at baseline to 7.1 episodes at 9 months follow-up. In comparison, women in the control group changed from 29.1 binge episodes at baseline to 9.8 at 9 months follow-up. The median number of drinks per week at baseline was reduced from 36 drinks to 2.3 drinks at 9 months for intervention women, compared to 38 drinks at baseline and 3.1 drinks at the 9-month follow-up for the control group. Women in the intervention group at the 9-month follow-up were more likely to reduce alcohol consumption to below risk levels at an OR of 1.5 (95% CI 1.1–2.2), and were also more likely to use effective contraception at an OR of 2.4 (95% CI 1.7–3.4). “Efficacy”, page 6
, and were also more likely to use effective contraception at an OR of 2.4 (95% CI 1.7–3.4). Efficacy , page 6.")
161
Preventing Alcohol-Exposed Pregnancies: A Randomized Controlled Trial Do you think this title provides a brief, informative summary of the article? Do you think the study intervention resulted in a decreased number/rate of alcohol-exposed pregnancies?

162
Preventing Alcohol-Exposed Pregnancies: A Randomized Controlled Trial Can we improve the title of this paper?

163
The TITLE Purpose: to provide a brief, informative summary that will attract your target audience What goes into the title? The Topic (T) being studied is always included. – study subjects and setting: “who, what, when, where” In addition, choose one or two of the following: – Methods (M) – Results (R) – Conclusions (C) – Specific named data set or study (N) Important: Emphasize what is new and useful!
 being studied is always included. – study subjects and setting: who, what, when, where In addition, choose one or two of the following: – Methods (M) – Results (R) – Conclusions (C) – Specific named data set or study (N) Important: Emphasize what is new and useful!.")
164
II THE PUBLICATION PROCESS

165
Conduct literature review Start the paper Conduct study/analyze data Organize/summarize results succinctly Get early, frequent feedback (in "chunks") Formulate your key message Apply the "new/useful" test Choose your target audience Choose your target journal Read journal instructions for authors Draft (and debug) an abstract Write the first draft Master the literature Relearn, rethink, rewrite... and rewrite and rewrite How long? Critically review and finalize the abstract Attend to the details Submit article to target journal Have a Plan B Mark your calendar

166
Conduct literature review

174
Finished?

175
Start the paper even before I do the study ??

177
Start the paper Draft the Introduction perhaps borrow from a study protocol or grant proposal that you already wrote Draft dummy table shells and figure axes for Results.

178
Conduct study/analyze data Now it’s time to write the first draft, right? Maybe not.

179
Organize/summarize results succinctly Fill in dummy tables and figures with real data. Draft additional tables and figures if needed – look at published articles for potential templates. Summarize each table/figure in a single sentence.

180
Get early, frequent feedback in "chunks"

181
Get early, frequent feedback Share your tables/figures and single-sentence summaries to coauthors/colleagues. Ask if they are clear/concise/compelling.

183
Smoking initiation rates were similar among adolescents and young adults from 1980 through 1984; from 1984 through 1989 rates increased among adolescents and decreased among young adults, (Fig). Smoking initiation rates were similar among adolescents and young adults from 1980 through 1984 (4.8-5.5% vs 4.4-5.1%); from 1984 through 1989 rates increased among adolescents and decreased among young adults, (Fig). Smoking initiation rates were similar among adolescents and young adults from 1980 through 1984 (4.8-5.5% vs 4.4-5.1%); from 1984 through 1989 rates increased among adolescents and decreased among young adults, (Fig). In 1988 and 1989 the smoking initiation rate among adolescents was about two percentage points higher than among young adults.
; from 1984 through 1989 rates increased among adolescents and decreased among young adults, (Fig). Smoking initiation rates were similar among adolescents and young adults from 1980 through 1984 ( % vs %); from 1984 through 1989 rates increased among adolescents and decreased among young adults, (Fig). In 1988 and 1989 the smoking initiation rate among adolescents was about two percentage points higher than among young adults..")
184
Get early, frequent feedback Show your tables/figures and single-sentence summaries to coauthors/colleagues. Ask if they are clear/concise/compelling. Give presentations to colleagues at work, at conferences. Try to formulate a concise key message.

185
Get early, frequent feedback Show your tables/figures and single-sentence summaries to coauthors/colleagues. Ask if they are clear/concise/compelling. Give presentations to colleagues at work, at conferences Try to formulate a concise key message. Get feedback.

186
Please listen carefully to what I am about to say... Don’t wait for a complete draft to begin getting feedback.

187
Thanks for your detailed and lengthy criticism of my manuscript. I’ll be sure to incorporate your suggestions into my next draft.

188
Formulate your key message Keep it simple; try to boil down to a single sentence. Your message must contain something new and useful. Make sure your results support your key message.

189
Formulate your key message Keep it simple; try to boil down to a single sentence. Your message must contain something new and useful. Make sure your results support your key message. The message may change as you develop the paper.

190
Apply the “new/useful” test

191
BMJ “Rejection Checklist” Why did we reject your paper? on balance, your paper is not sufficiently interesting for general readers (relative to other papers) the message is not new enough the topic is interesting but the paper does not cover it in enough depth the paper adds a small amount of new information but not enough to warrant space in the BMJ the message is not useful enough in practice
 the message is not new enough the topic is interesting but the paper does not cover it in enough depth the paper adds a small amount of new information but not enough to warrant space in the BMJ the message is not useful enough in practice.")
192
BMJ “Rejection Checklist” Why did we reject your paper? on balance, your paper is not sufficiently interesting for general readers (relative to other papers) the message is not new enough the topic is interesting but the paper does not cover it in enough depth the paper adds a small amount of new information but not enough to warrant space in the BMJ the message is not useful enough in practice
 the message is not new enough the topic is interesting but the paper does not cover it in enough depth the paper adds a small amount of new information but not enough to warrant space in the BMJ the message is not useful enough in practice.")
193
What/Who is a “general reader”?

194
BMJ Mission Statement to lead the debate on health, and to engage, inform, and stimulate doctors, researchers and other health professionals in ways that will improve outcomes for patients

195
BMJ Mission Statement to lead the debate on health, and to engage, inform, and stimulate doctors, researchers and other health professionals in ways that will improve outcomes for patients

196
Choose your target audience

197
Choose your target journal

198
Criteria –A journal that matches your target audience –How strong is your article?

199
Addiction Journals AIDS Journals Allergy Medicine/Allergology Journals Allied Health Anatomy Journals Anesthesiology Journals Arthritis Journals Biochemistry Journals Bioengineering & Biomechanics Journals Biotechnology Journals Cardiology Journals Chiropractic Journals Complementary & Alternative Medicine Journals Critical Care Journals Dentistry Journals Dermatology Journals Developmental Disabilities Journals Diabetes Journals Education, Medical Journals Embryology Journals Emergency Medicine Journals Endocrinology Journals ENT/Otolaryngology Journals Environmental Medicine Journals Epidemiology Journals Evidence Based Medicine Journals Family Medicine Journals Forensic Science Journals Gastroenterology Journals General Medicine Journals Genetics & Genomics Journals Geriatrics Journals Gerontology Journals Gynecology Journals Health & Wellness Journals Healthcare Management Journals Hematology Journals Hepatology Journals Hospital Management Journals Imaging Journals Immunology Journals Infectious Disease Journals Infertility Journals Intensive Care Journals Interdisciplinary Medical Journals Internal Medicine Journals Laboratory Science Journals Managed Care Journals Medical Assessment Journals Medical Computing Journals Medical Devices and Diagnostics Journals Medical Economics Journals Medical Education Journals Medical Ethics Journals Medical Informatics Journals Medical Law Journals Medical Physics Journals Medical Policy Journals Medical Practice Journals Medical Statistics Journals Medical Technology Journals Mental Health Journals Metabolism Journals Microbiology Journals Molecular Medicine Journals Mycology Journals Neonatology Journals Nephrology Journals Neurology Journals Neuroscience Journals Nuclear Medicine Journals Nursing Journals Nutrition Journals Obstetrics Journals Occupational Medicine Journals Oncology Journals Ophthalmology Journals Oral Medicine Journals Orthodontics Journals Orthopaedic Journals Orthotics Journals Osteopathic Medicine Journals Otolaryngology Journals Pain Management Parasitology Journals Pathology Journals Pediatrics Journals Pharmacology Journals Physical & Occupational Therapy Journals Physical Medicine Journals Physiology Journals Plastic & Reconstructive Surgery Podiatry Journals Preventive Medicine Journal Primary Care Journals Prosthetics Journals Protozoology Journals Psychiatry Journals Psychology Journals Public Health Journals Pulmonary/Pulmonology Journals Radiology Journals Rehabilitation Journals Reproductive Medicine Journals Respiratory Medicine Journals Rheumatology Journals Sexuality Journals Social Work Journals Sports Medicine Journal Stomatology Journals Substance Abuse Journals Surgery Journals Teratology Journals Toxicology Journals Transplantation Journals Travel Medicine Journals Tropical Medicine Journals Urology Journals Vascular Medicine Journals Veterinary Journals Virology Journals Women's Health Journals

200
Instructions for authors can help to confirm whether your topic is relevant to the journal’s mission e.g. Is AJPH interested in global health?

201
“The foremost mission of the American Journal of Public Health is to promote public health research, policy, practice, and education. We aim to embrace all of public health, from global policies to the local needs of public health practitioners. Contributions of original unpublished research, social science analyses, scholarly essays, critical commentaries, departments, and letters to the editor are welcome.”

203
Instructions for authors And now for the details...

204
“I certify that...”

205
Final approval of manuscript

206
“take public responsibility”

207
document your contributions

208
Postmenopausal Hormone Therapy and Risk of Cardiovascular Disease by Age and Years Since Menopause JAMA. 2007;297:1465-1477 (Vol. 297 No. 13, April 4, 2007)
.")
210
Submission Checklist Cover letter with conflict of interest disclosure Justification for more than 6 authors Explanation of authors' contributions Abstract (correct format and word limit) Text (manuscript file in Word format) References (accuracy, style, and numbering) Acknowledgments (funding sources, contributors who didn't fulfill authorship requirements) Human Participant Protection (IRB approval, consent) Tables (numbered, with title and footnotes) Figures (numbered, black-and-white, EPS, WMF, PPT, or PDF) Related supplementary material, including images (TIFF, PSD, EPS, WMF, PDF, or JPEG of more than 300 dpi, 4" x 6") from: http://www.ajph.org/misc/ifora.shtml (March 7, 2008)
 Text (manuscript file in Word format) References (accuracy, style, and numbering) Acknowledgments (funding sources, contributors who didn t fulfill authorship requirements) Human Participant Protection (IRB approval, consent) Tables (numbered, with title and footnotes) Figures (numbered, black-and-white, EPS, WMF, PPT, or PDF) Related supplementary material, including images (TIFF, PSD, EPS, WMF, PDF, or JPEG of more than 300 dpi, 4 x 6 ) from: (March 7, 2008)")
211
Draft (and debug) an abstract
 an abstract")
212
Purpose Methods Results Conclusions RELIABILITY VALIDITY RELIABILITY FLEXIBILITY UTILITY

213
Write the first draft Finally!

214
Write the first draft Write for your target audience (use appropriate terminology/jargon). Consider using an outline. Don’t sweat the grammar, syntax or details (only you need to understand the first draft).
..")
215
When the Journal Responds Acknowledgment of receipt Internal review External review Comments from editors/referees Responding to the comments Writing the cover letter When to contact the editor

216
When the Journal Responds Acknowledgment of receipt Internal review External review Comments from editors/referees Responding to the comments Writing the cover letter When to contact the editor

219
When the Journal Responds Acknowledgment of receipt Internal review External review Comments from editors/referees Responding to the comments Writing the cover letter When to contact the editor

220
American Journal of Public Health Production Information Please help conserve precious Journal resources by consulting this and our other informational pages before directly contacting production staff with questions ajph.production@apha.org

221
# months Author submission to journal acceptance4-6 Acceptance to publication4-6 8-12 Complete data analysis to journal submission6-12 Begin data analysis to complete data analysis3-8 24-37 How Long Does it Take?

222
# months Author submission to journal acceptance4-6 Acceptance to publication4-6 8-12 Complete data analysis to journal submission6-12 Begin data analysis to complete data analysis3-8 24-37 How Long Does it Take?

223
# months Author submission to journal acceptance4-6 Acceptance to publication4-6 8-12 Complete data analysis to journal submission6-12 Begin data analysis to complete data analysis4-8 Begin data analysis to publication 18-32 How Long Does it Take?

224
The Secret of Success

225
Pathway to Productivity

226
The Secret of Success Conduct literature review Start the paper Conduct study/analyze data Organize/?summarize results succinctly Get early, frequent feedback (in "chunks") Formulate your key message Apply the "new/useful" test Choose your target audience Choose your target journal Read journal instructions for authors Draft (and debug) an abstract Write the first draft ?
 Formulate your key message Apply the new/useful test Choose your target audience Choose your target journal Read journal instructions for authors Draft (and debug) an abstract Write the first draft")
227
The Secret of Success Conduct literature review Start the paper Conduct study/analyze data Organize/summarize results succinctly Get early, frequent feedback (in "chunks") Formulate your key message Apply the "new/useful" test Choose your target audience Choose your target journal Read journal instructions for authors Draft (and debug) an abstract Write the first draft
 Formulate your key message Apply the new/useful test Choose your target audience Choose your target journal Read journal instructions for authors Draft (and debug) an abstract Write the first draft")
228
The Secret of Success Conduct literature review Start the paper Conduct study/analyze data Organize/summarize results succinctly Get early, frequent feedback (in "chunks") Formulate your key message Apply the "new/useful" test Choose your target audience Choose your target journal Read journal instructions for authors Draft (and debug) an abstract Write the first draft Organize/summarize results succinctly Get early, frequent feedback (in "chunks") Formulate your key message Apply the "new/useful" test Choose your target audience Choose your target journal Read journal instructions for authors Draft (and debug) an abstract
 Formulate your key message Apply the new/useful test Choose your target audience Choose your target journal Read journal instructions for authors Draft (and debug) an abstract Write the first draft Organize/summarize results succinctly Get early, frequent feedback (in chunks ) Formulate your key message Apply the new/useful test Choose your target audience Choose your target journal Read journal instructions for authors Draft (and debug) an abstract")
Similar presentations
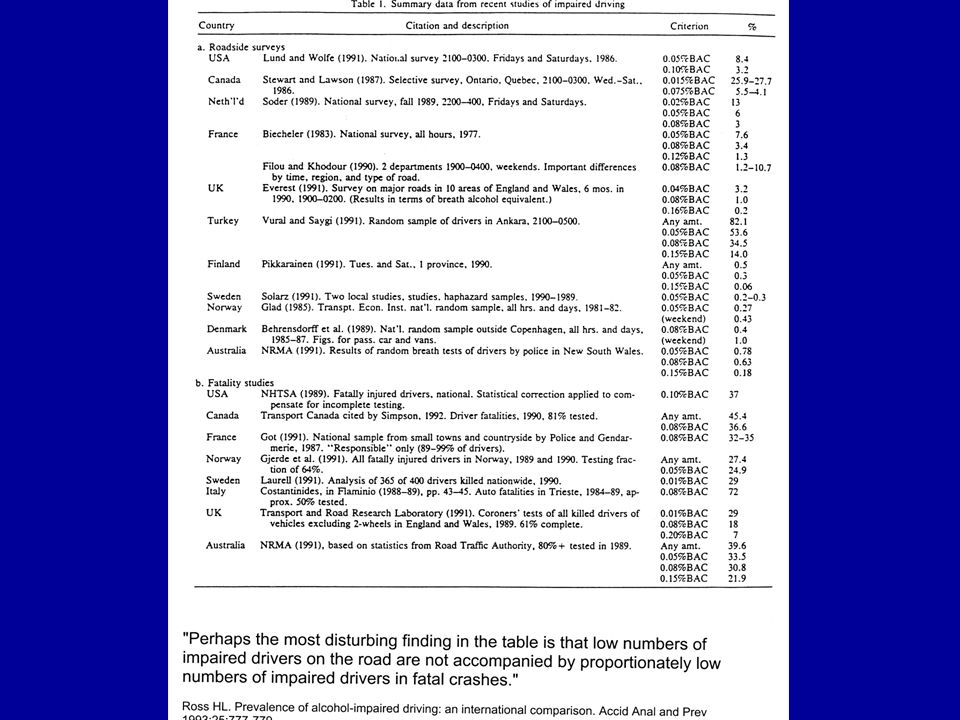


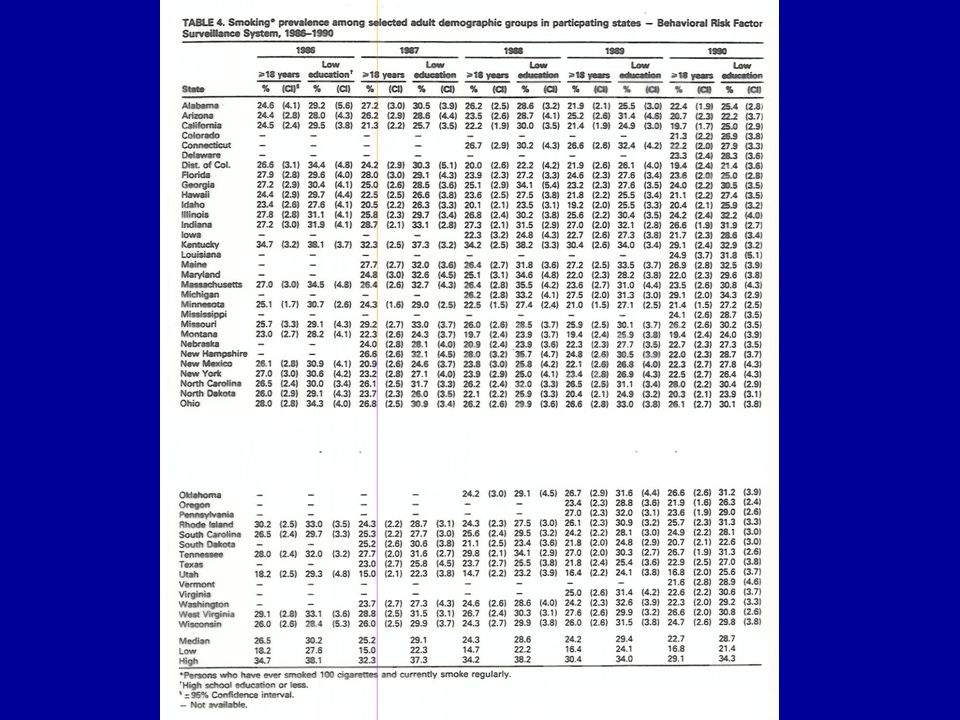

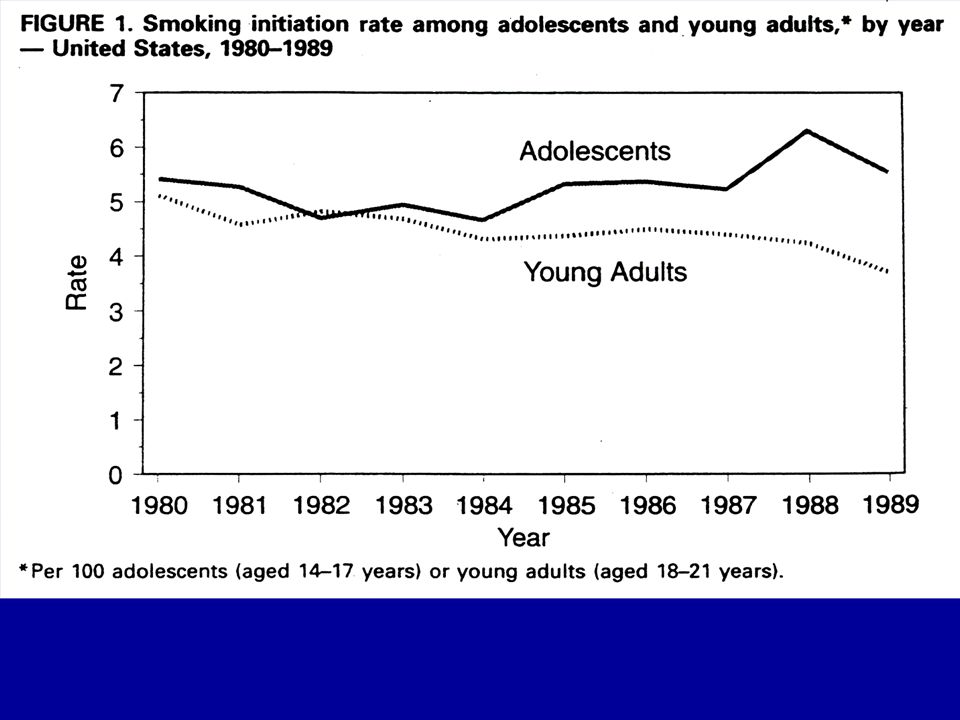
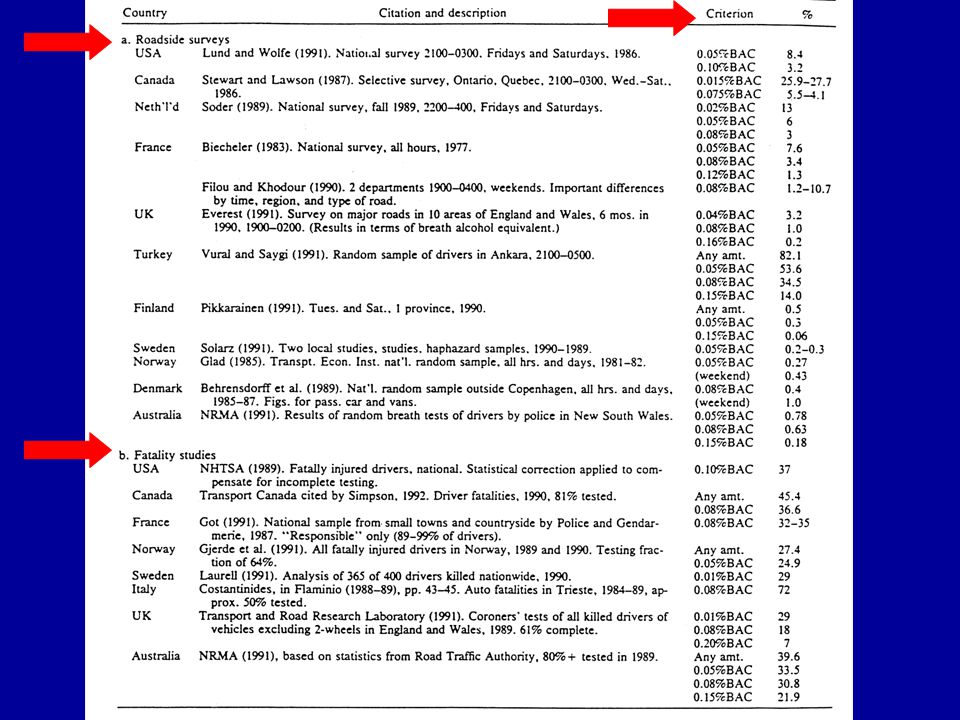
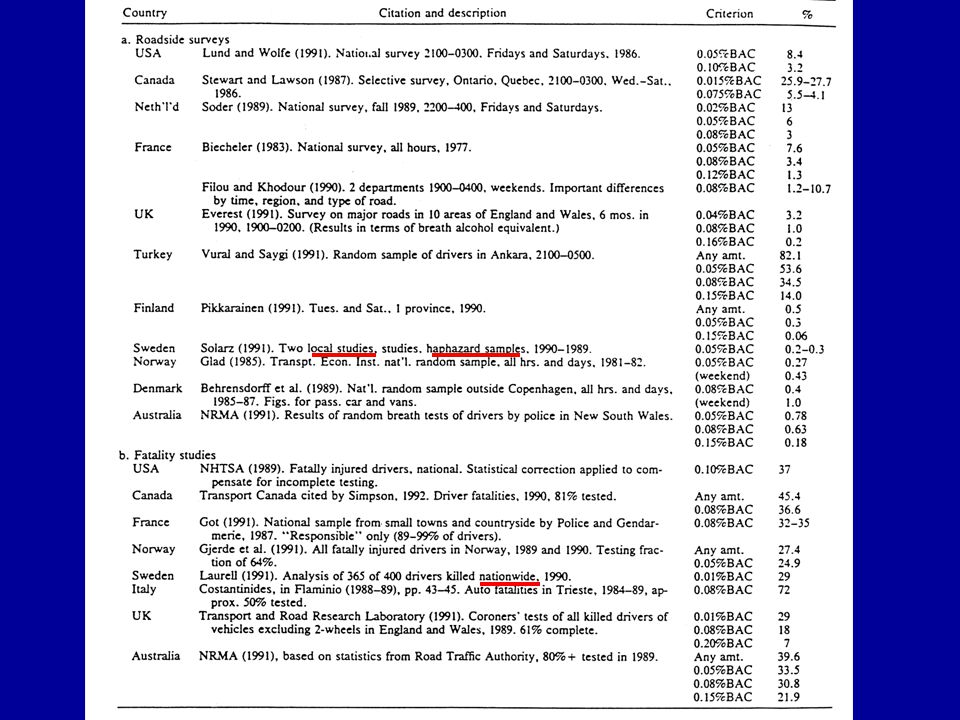


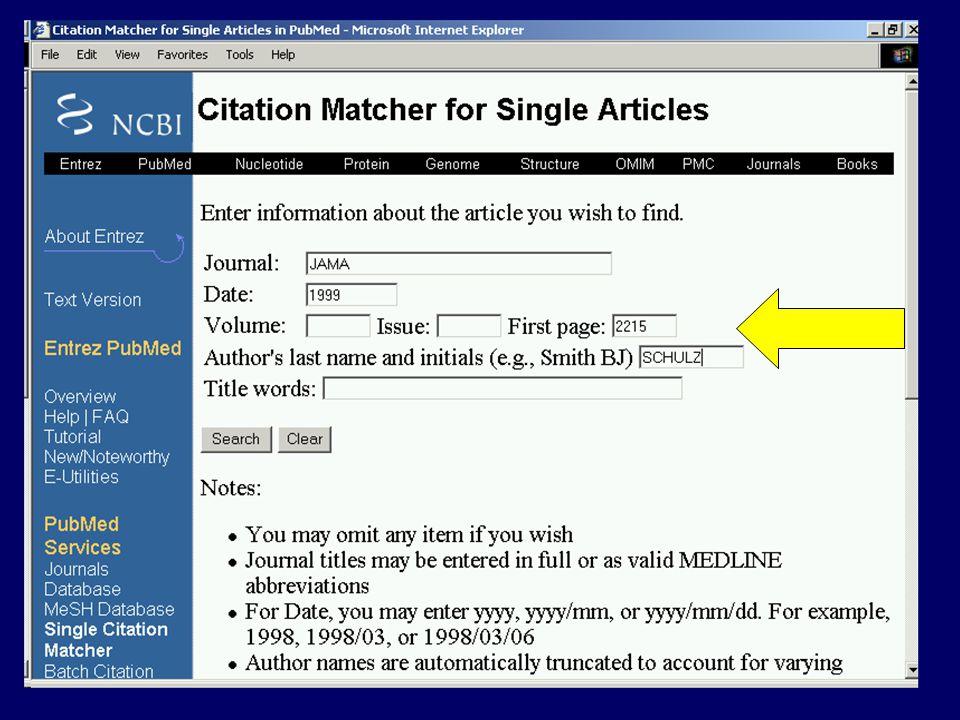


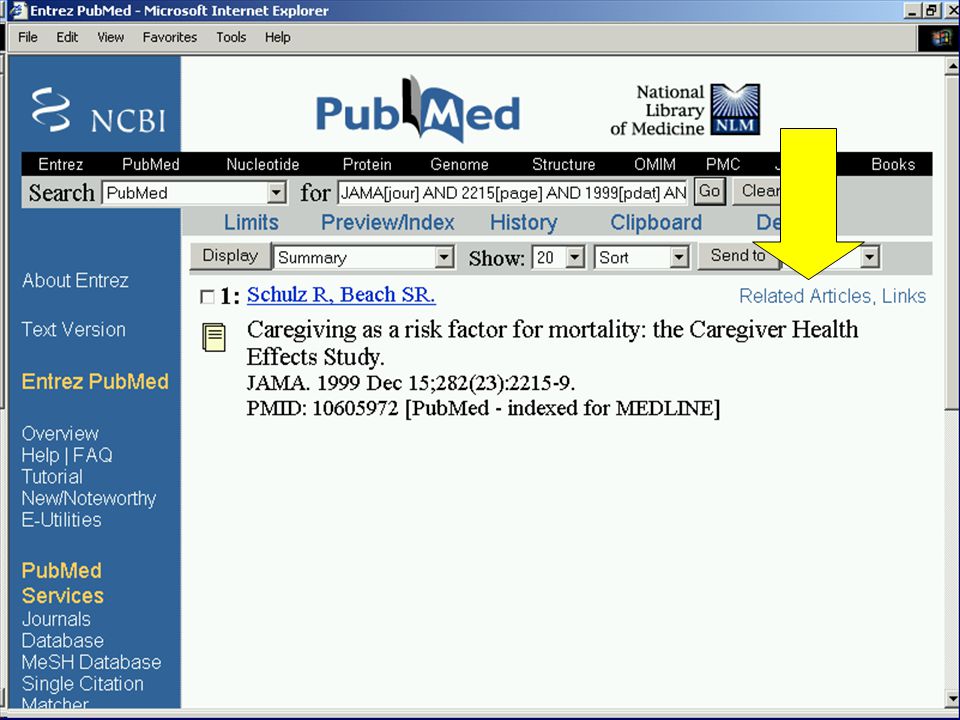

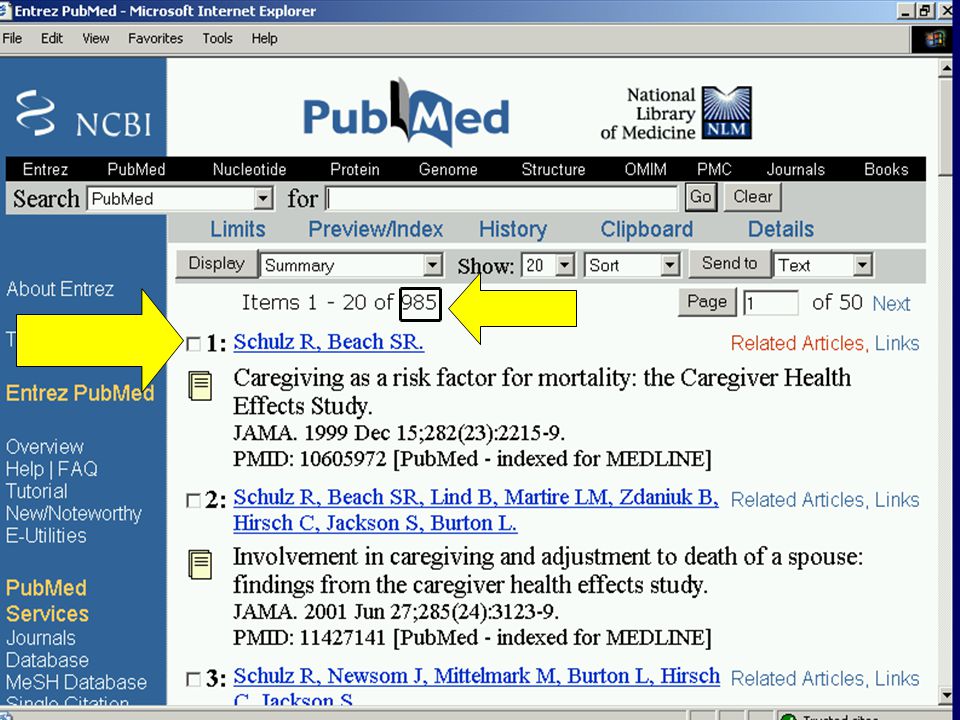


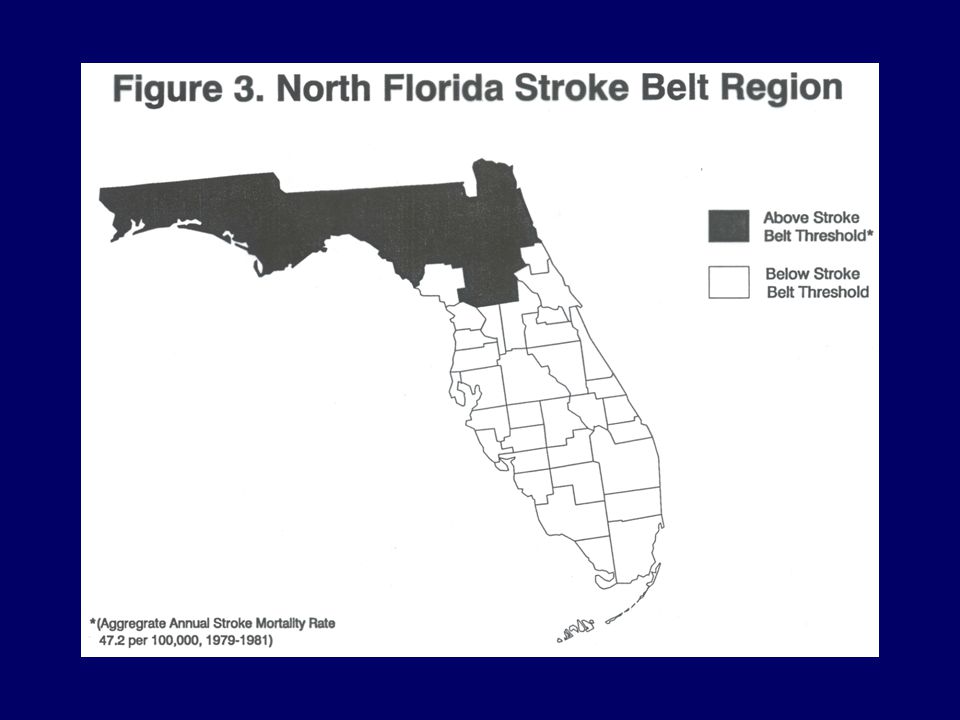
>")


