Download presentation
Presentation is loading. Please wait.

1
Intergenerational Mobility Curves Jon Davis Harris School of Public Policy, Univ. of Chicago Bhash Mazumder Federal Reserve Bank of Chicago November 4, 2014

2
This talk also includes some very preliminary work on: “A Comparison of Intergenerational Mobility Curves in Germany, Norway, Sweden and the U.S” with: Espen Bratberg, University of Bergen Jon Davis, Harris School of Public Policy, University of Chicago Martin Nybom, SOFI, Stockholm University Daniel Schnitzlein, University of Hannover Kjell Vaage, University of Bergen hceconomics.org

3
Goals Introduce the general approach of “mobility curves”: – Follow Aaberge and Mogstad (2012) who study intragenerational mobility by applying concepts from the inequality/social welfare literature (Atkinson 1970, Yaari 1988, Aaberge and Mogstad 2010). We further extend this to intergenerational mobility – Consider mobility across the entire income distribution, hence a “curve” – Allows for potential nonlinearities and differences in upward vs. downward moves – Useful for comparing subgroups or different populations We consider both absolute and relative mobility as well as a hybrid Compare mobility over time, across groups, and across countries Will consider both individual and geographic covariates Can analyze mobility with respect to other outcomes, (e.g. test scores) Eventually, can try to make statements about social welfare hceconomics.org
 Eventually, can try to make statements about social welfare hceconomics.org.")
4
Background Newer focus in literature on rank-based measures – Bhattacharya and Mazumder (2011), Mazumder (2014) and Corak, Lindquist and Mazumder (forthcoming) use directional rank mobility – Dahl and Deliere (2008) and Chetty et al (2014) use intergenerational rank association. – Conceptually these measures are about positional mobility and abstract from magnitude of income differences (inequality) Has intergenerational mobility changed over time? – Long and Ferrie (2013): occ. mobility fell from 19 th to mid-20 th century – Mixed evidence for 20 th century PSID studies suggest no trend in recent decades (e.g. Hertz, 2008; Lee and Solon, 2009) Other studies (e.g. Aaronson and Mazumder, 2008) suggest that mobility changes correspond to inflection points in inequality/returns to schooling (e.g. 1940 and 1980). Chetty et al (2014b) show no trend in rank association but only for cohorts born since 1970 (observed at young ages) who entered labor market in 1990s and 2000s. hceconomics.org
 Has intergenerational mobility changed over time. – Long and Ferrie (2013): occ. mobility fell from 19 th to mid-20 th century – Mixed evidence for 20 th century PSID studies suggest no trend in recent decades (e.g. Hertz, 2008; Lee and Solon, 2009) Other studies (e.g. Aaronson and Mazumder, 2008) suggest that mobility changes correspond to inflection points in inequality/returns to schooling (e.g and 1980). Chetty et al (2014b) show no trend in rank association but only for cohorts born since 1970 (observed at young ages) who entered labor market in 1990s and 2000s. hceconomics.org.")
5
Background (cont.) Large racial differences in intergenerational mobility in US – Hertz (2005) found blacks substantially less upwardly mobile and whites substantially more downwardly mobile using PSID. – Bhattacharya and Mazumder (2011) and Mazumder (2014) find similar results using multiple data sources and with rank measures. Results imply no convergence in the steady state distribution – But…no evidence yet on Hispanics Large geographic differences found by Chetty et al (2014) – Use millions of tax records for 1980-82 cohorts observed in 2011-12. – Construct two measures for each commuting zone: Expected rank for individuals coming from 25 th percentile Slope of intergenerational rank association line – However, limited individual covariates (e.g. race, parent education) hceconomics.org
 and Mazumder (2014) find similar results using multiple data sources and with rank measures. Results imply no convergence in the steady state distribution – But…no evidence yet on Hispanics Large geographic differences found by Chetty et al (2014) – Use millions of tax records for cohorts observed in – Construct two measures for each commuting zone: Expected rank for individuals coming from 25 th percentile Slope of intergenerational rank association line – However, limited individual covariates (e.g. race, parent education) hceconomics.org.")
8
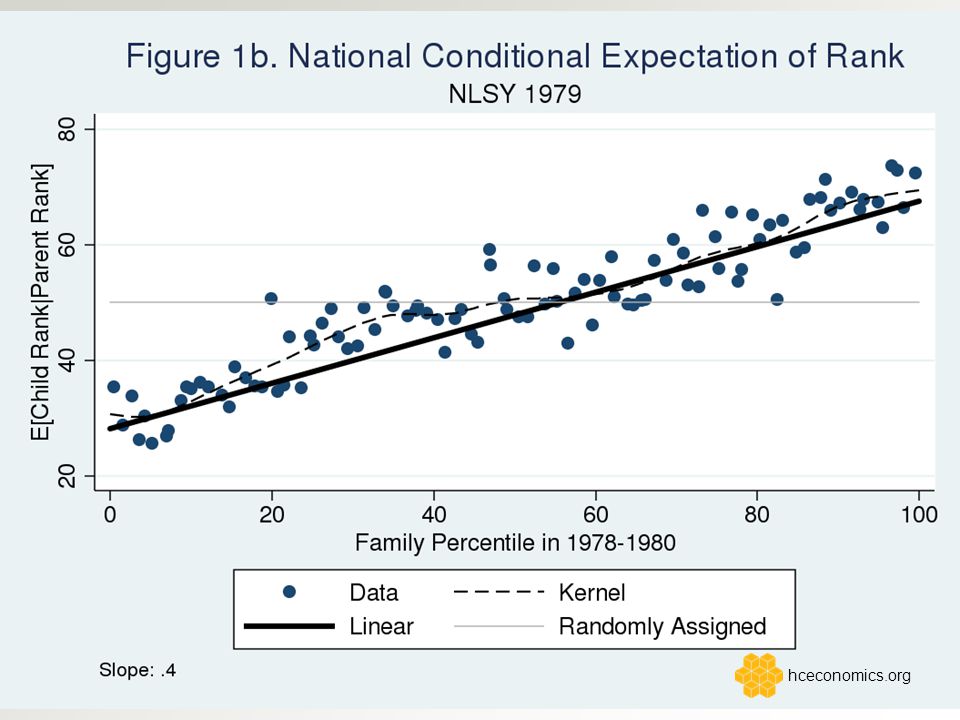
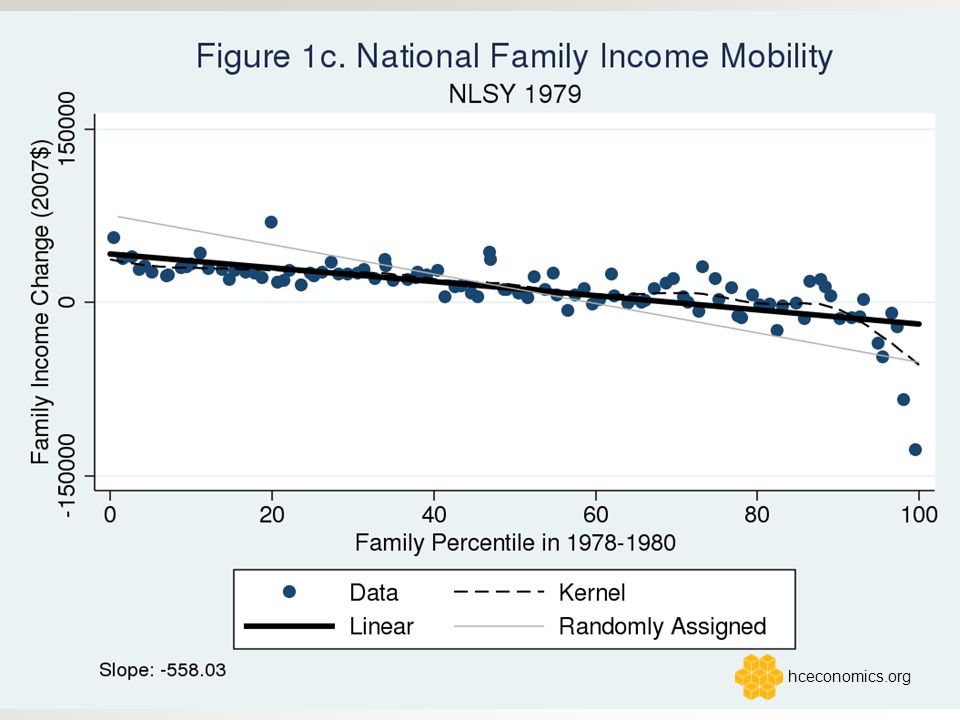
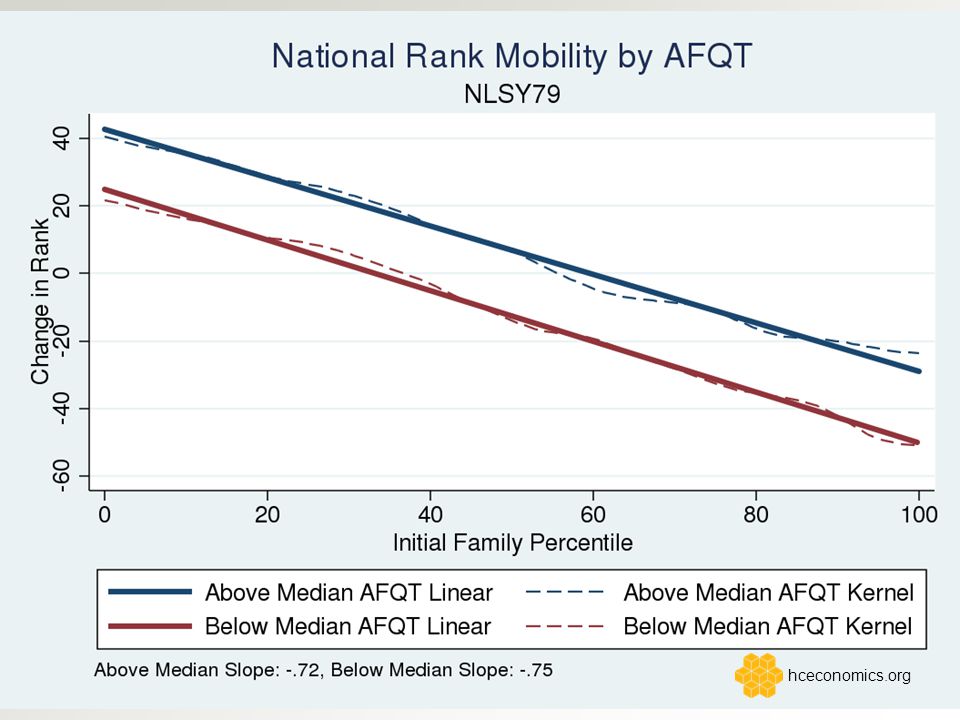
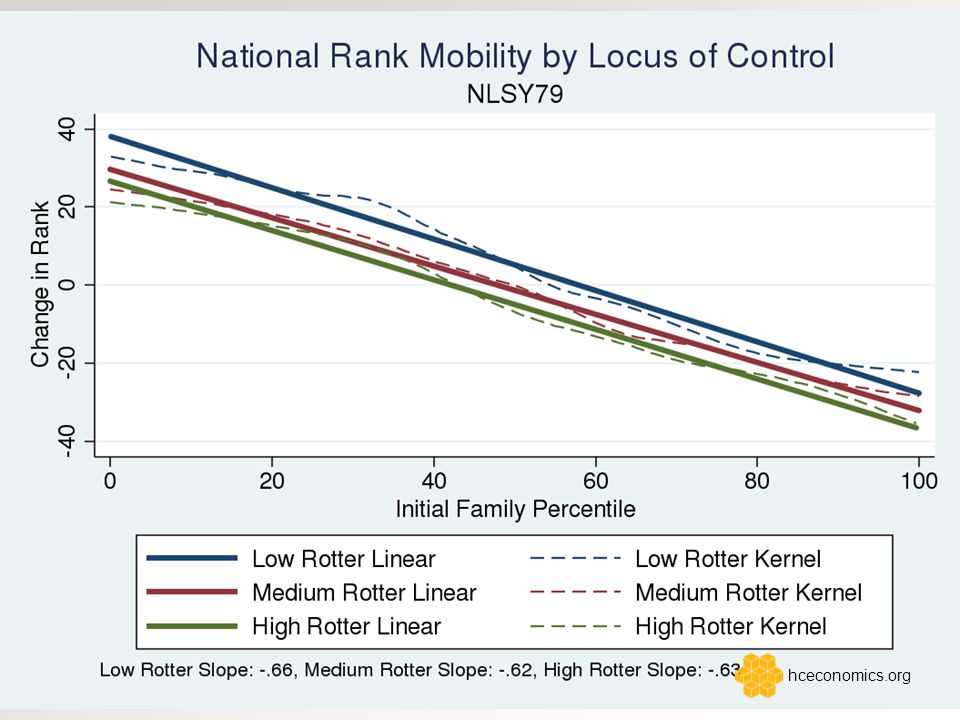
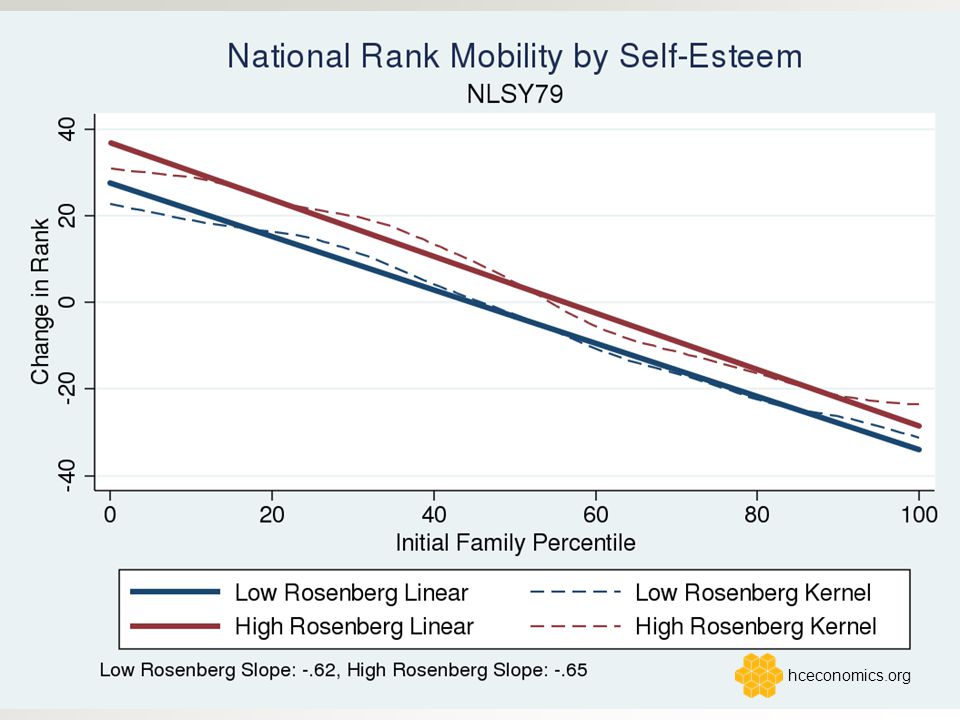
Three Mobility Curve Measures Rank Mobility (rank changes): - where 0,1 index generations and p is the percentile in the parent generation - we will show a) raw data b) smoothed kernel c) linear - RM contains same info as conditional expected rank (“rank association”) Absolute Mobility (change in income) Income Share Mobility (change in income share) hceconomics.org
: - where 0,1 index generations and p is the percentile in the parent generation - we will show a) raw data b) smoothed kernel c) linear - RM contains same info as conditional expected rank ( rank association ) Absolute Mobility (change in income) Income Share Mobility (change in income share) hceconomics.org")
9
Baseline US Data: NLSY79 Kids between ages of 14-22 in 1979 followed into adulthood Parent Generation: use average total net family income over 1978, 1979 and 1980. – Includes all non-missing years of income (includes zero income) – Boys and girls living with parent, income reported directly by parent – 31% have 3 years of income, 24% have 2 years, 21% have 1 year. Use average of adult child’s total net family income in 1996, 1998, 2000, 2002, 2004, 2006 and 2008 (when non-missing). – 36 percent have all 7 years of income, 65 percent have at least 4 years of income. – Adult children ages are between 33 and 52 Include oversamples and use weights Our final sample includes 6767 observations on 1957-64 cohorts
 – Boys and girls living with parent, income reported directly by parent – 31% have 3 years of income, 24% have 2 years, 21% have 1 year. Use average of adult child’s total net family income in 1996, 1998, 2000, 2002, 2004, 2006 and 2008 (when non-missing). – 36 percent have all 7 years of income, 65 percent have at least 4 years of income. – Adult children ages are between 33 and 52 Include oversamples and use weights Our final sample includes 6767 observations on cohorts.")
10
hceconomics.org

14
US Trends hceconomics.org

15
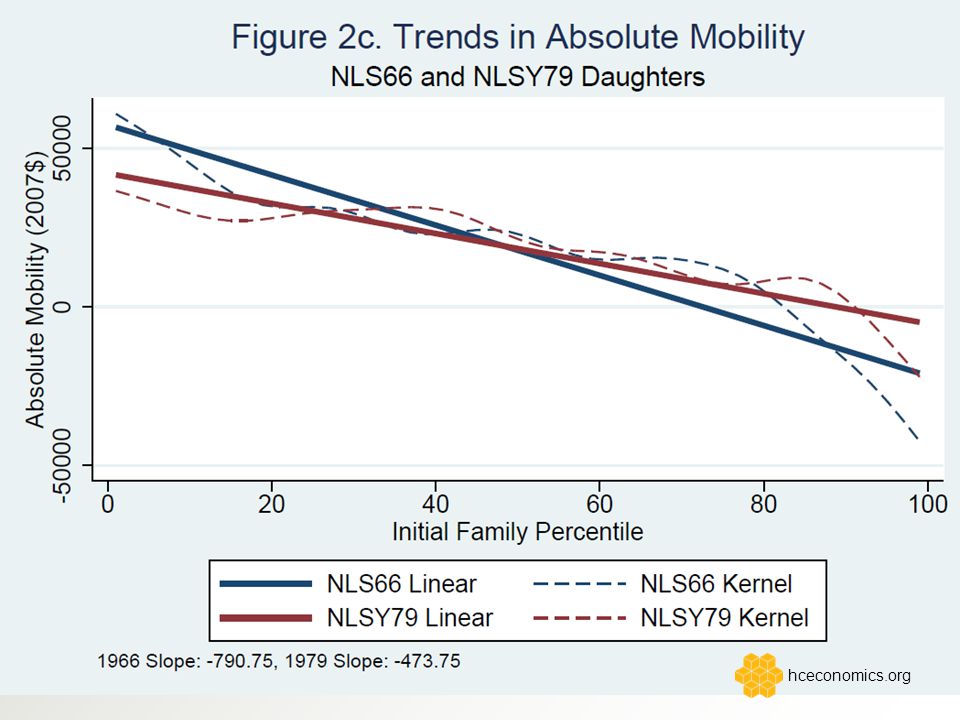
Compare NLSY79 to NLS66 NLS66 covers children between ages of 14-24 in 1966 – Young Women followed until 2001 (Young men only to 1981) – Linked to Mature Men/Women cohorts =>fathers and mothers Parent generation: – Use average total net family income over 1965, 1966 and 1968. Daughters: Use avg. of total net family income in 1991, 1993, 1995, 1997, 1999, and 2001 (when non-missing). Age is between 38 and 59 Include oversamples and use weights Adjust NLSY sample to match parent age range of NLS66 Final sample: 978 daughters, 1942-52 cohorts Caveat: Shows changes in positional mobility only and does not account for changes in inequality across these cohorts
. Age is between 38 and 59 Include oversamples and use weights Adjust NLSY sample to match parent age range of NLS66 Final sample: 978 daughters, cohorts Caveat: Shows changes in positional mobility only and does not account for changes in inequality across these cohorts.")
16
Mobility Curve Comparisons When comparing rank mobility curves across different populations (e.g. countries, over time) : – Curves will almost certainly cross – Different social welfare functions may yield different normative conclusions – Depend on upward mobility at bottom vs downward mobility at the top – Absolute mobility curves may very well not cross When comparing curves within a given population (e.g. subgroups such as race, region, ethnicity using a fixed distribution) – Curves may or may not cross – Stochastic dominance more likely and one group’s mobility curve might always be preferred over another hceconomics.org
 : – Curves will almost certainly cross – Different social welfare functions may yield different normative conclusions – Depend on upward mobility at bottom vs downward mobility at the top – Absolute mobility curves may very well not cross When comparing curves within a given population (e.g. subgroups such as race, region, ethnicity using a fixed distribution) – Curves may or may not cross – Stochastic dominance more likely and one group’s mobility curve might always be preferred over another hceconomics.org.")
17
Moving from 0.26 to 0.40 equivalent to moving from 40 th to 338 th ranked city using Chetty et al online tables hceconomics.org

20
Discussion of Trends Change in slope consistent with previous evidence – Aaronson and Mazumder (JHR, 2008) show historical changes in IGE associated with changes in return to schooling and 90/10 wage gap hceconomics.org
 show historical changes in IGE associated with changes in return to schooling and 90/10 wage gap hceconomics.org")
22
Discussion of Trends Change in slope consistent with previous evidence – Aaronson and Mazumder (JHR, 2008) show historical changes in IGE associated with changes in return to schooling – Bloome and Western (2011) also document a decline in mobility across these cohorts using NLS and NLSY surveys – Levine and Mazumder (2007) show mobility declined across these cohorts by using brother correlations Bjorklund and Jantti, 2013 argue that this is a preferred measure. hceconomics.org

24
Discussion of Trends Change in slope consistent with previous evidence – Aaronson and Mazumder (JHR, 2008) show historical changes in IGE associated with concurrent changes in return to schooling – Bloome and Western (2011) document similar decline in mobility – Levine and Mazumder (2007) show mobility declined across these cohorts by using brother correlations Bjorklund and Jantti, 2013 argue that this is a preferred measure. – Rank association might not have changed even if IGE did Other Evidence Misses the Inflection Point: – Chetty et al (2014b) only covers cohorts born since 1970 who entered the labor market in the 1990s well after the rise in inequality. – PSID evidence (e.g. Hertz, 2008, Lee and Solon, 2009), may not be ideal Oldest cohort living at home in 1968 is 1951 Don’t get a great read of IGE for this cohort until mid 1980s. hceconomics.org
 only covers cohorts born since 1970 who entered the labor market in the 1990s well after the rise in inequality. – PSID evidence (e.g. Hertz, 2008, Lee and Solon, 2009), may not be ideal Oldest cohort living at home in 1968 is 1951 Don’t get a great read of IGE for this cohort until mid 1980s. hceconomics.org.")
25
Chetty et al (2014b) Good coverage in PSID hceconomics.org
 Good coverage in PSID hceconomics.org")
26
Cross-country differences hceconomics.org

27
International Samples Germany, SOEP survey data – 1071 parent-child pairs. Kids born 1957-79. Avg. HH income measured over 2001-2012 when between ages of 32-54 – Parents born 1926-1956, avg. HH income over 1984-1986. – Household income based on cohabitation with partner. Norway, administrative data, xx% random sample – 328 428 parent-child pairs. Kids born 1957-1964. Avg. HH earnings measured over 1996-2008 when between ages of 32-51. – Parents born between 1920 and 1950, avg. family earnings over 1978-80 Sweden, administrative data, 35% random sample – 252,745 parent-child pairs. Kids born 1957-1964. Avg. HH income measured every other year from 1999-2006 and 2007, kids b/w 35-50 – Parents born between 1920 and 1950, avg. HH income over 1978-80

28
There are only 11 out of 384 US cities with a rank- rank slope <=0.22 hceconomics.org

30
Discussion of Cross-Country Differences U.S. is as much an outlier using rank measures of intergenerational mobility as with IGE – This was not so clear in Corak, Lindquist and Mazumder (forthcoming) – Consistent with evidence for Denmark (slope = 0.18) from Boserup et al (2013) shown in Chetty et al (2014) Cross-country differences shown here are much larger than differences within the US emphasized by Chetty et al. (2014) Important non-linearities when looking across countries. – Mobility differences between US and other countries appear to be more extreme at the tails. Mobility similar between 35 th and 60 th percentiles Results fairly robust to conceptual differences in income Mobility better in the US for those in the top-half Absolute mobility differences yet to come hceconomics.org
 – Consistent with evidence for Denmark (slope = 0.18) from Boserup et al (2013) shown in Chetty et al (2014) Cross-country differences shown here are much larger than differences within the US emphasized by Chetty et al. (2014) Important non-linearities when looking across countries. – Mobility differences between US and other countries appear to be more extreme at the tails. Mobility similar between 35 th and 60 th percentiles Results fairly robust to conceptual differences in income Mobility better in the US for those in the top-half Absolute mobility differences yet to come hceconomics.org.")
31
Differences in US by Characteristics hceconomics.org

32
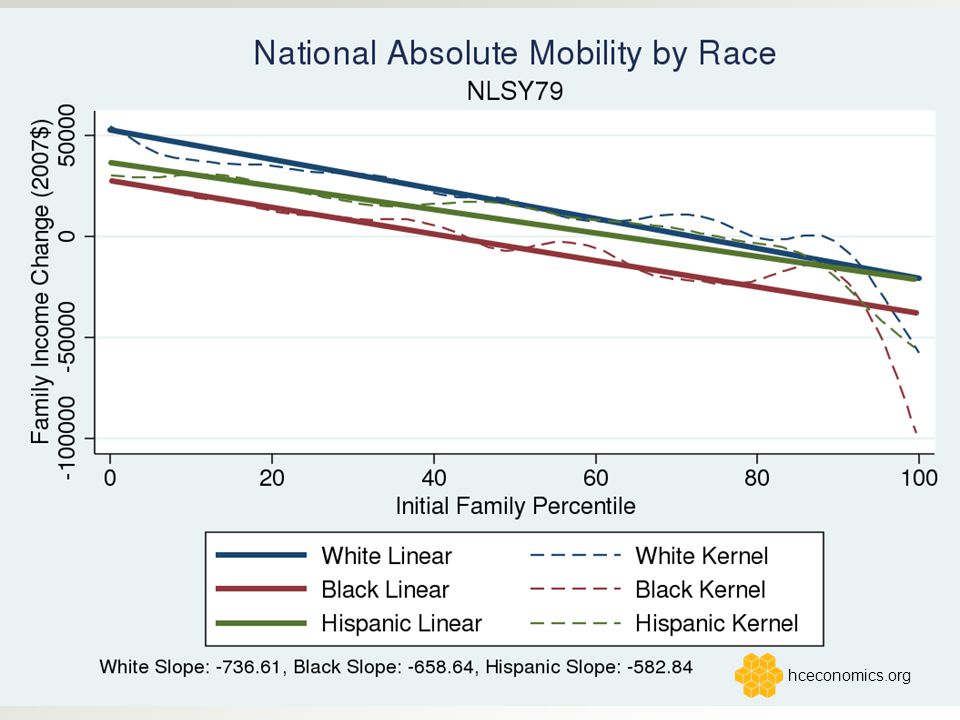
NLSY 79 Characteristics Stratify by Race/Ethnicity and Region – Black, White and Hispanics – South at 14; Northeast, Midwest, South and West at 18 – Future work will use geocoded NLSY to get county level attributes at birth Child and Parent Characteristics: – Kids: AFQT scores, Non-cognitive measures – Family Background Characteristics: Each possible combination of Biological or Non-Biological Parent present. – Parent education: HS, Some College, College, Graduate School hceconomics.org

33
Differences by Race/Region

34
hceconomics.org

36
Summary of Race/Ethnicity Stark racial/ethnic differences throughout the distribution in both absolute and relative mobility Ordering of curves appears to be constant as follows: 1) whites 2) hispanics 3) blacks Stochastic dominance criteria is easy to apply Racial differences persist even after including family background controls (not shown) Previous research has largely ignored Hispanics Mobility (based on slope) declined for whites and blacks – Mobility unambigously worse for Blacks throughout distribution hceconomics.org
 whites 2) hispanics 3) blacks Stochastic dominance criteria is easy to apply Racial differences persist even after including family background controls (not shown) Previous research has largely ignored Hispanics Mobility (based on slope) declined for whites and blacks – Mobility unambigously worse for Blacks throughout distribution hceconomics.org")
39
Summary of Regional Differences Regional differences are not so stark at aggregate level Northeast generally dominates, West has flattest slope South and North Central are fairly similar Regional mobility curves cross leading to potentially interesting/nuanced comparisons – e.g. West may be preferred to South for upward rank mobility from bottom but not for downward rank mobility at the top Conditional on family background, South fares worst Now we turn to looking at both race and region – Chetty et al (2014a) only look at this indirectly since tax data does not identify race hceconomics.org
 only look at this indirectly since tax data does not identify race hceconomics.org.")
40
Racial Gaps by South/non-South Regional Gaps for Blacks and Hispanics

41
hceconomics.org

42
Summary of Race by Regional Differences Overall mobility disadvantage in South conceals considerable heterogeneity by racial group Blacks and Hispanics are largely doing better in the South, while Whites are largely doing worse. Provides more complete picture – Geographic differences not so large within group – Regional differences are partially driven by race but not in the “expected” way – While it is true that worse mobility in South is not driven by Blacks (who actually offset it) it is driven by Whites hceconomics.org
 it is driven by Whites hceconomics.org.")
43
Differences by Cognitive and Non-Cognitive Skills hceconomics.org

50
Summary of Cognitive/Non-cognitive skills Large gaps in mobility by cognitive skills for both absolute and relative mobility Smaller but still notable mobility gaps by non-cognitive skills hceconomics.org

51
Conclusion Introduce new approach to examining intergenerational mobility using mobility curves (building on previous literature) Present absolute and relative mobility curves for a representative sample of US cohorts now in their 50s Document a sharp decline in relative rank mobility (slope) compared to earlier cohorts Consistent with some prior work based on inequality trends Show US is an outlier relative to Germany, Norway, and Sweden Document US racial gaps in absolute, relative mobility and first evidence on intergenerational mobility of Hispanics Provide more nuanced evidence on race and region Cognitive skills and non-cognitive skills (to a lesser extent) are associated with mobility hceconomics.org
 Present absolute and relative mobility curves for a representative sample of US cohorts now in their 50s Document a sharp decline in relative rank mobility (slope) compared to earlier cohorts Consistent with some prior work based on inequality trends Show US is an outlier relative to Germany, Norway, and Sweden Document US racial gaps in absolute, relative mobility and first evidence on intergenerational mobility of Hispanics Provide more nuanced evidence on race and region Cognitive skills and non-cognitive skills (to a lesser extent) are associated with mobility hceconomics.org")
Similar presentations


 Paul Gregg (University of Bristol) Lindsey Macmillan (Kennedy School of Government, Harvard)>")


 What is available over time? Longitudinal perspectives Complimentary analytical inputs and outputs How to.>")


