Download presentation
Presentation is loading. Please wait.

1
Investments in Human Capital: The People Based Economy Kevin M. Murphy The University of Chicago September 3, 2012

2
Background

3
U.S. Real Per Capita GDP 1889-2010

4
Where Does Growth Come From? There are three primary sources of growth Investment in physical capital Investment in human capital Improvements in technology (knowledge) Primary goals of policy should be to Maintain the incentive for physical investment Provide an environment that fosters the growth of human capital Provide rewards for innovation
 Primary goals of policy should be to Maintain the incentive for physical investment Provide an environment that fosters the growth of human capital Provide rewards for innovation.")
5
How do People Fit into the Economic Picture? People are important as both inputs and outputs Human capital is our most important input Accounts for roughly 65 percent of our productive capacity With increasingly mobile capital and technology, countries will be increasingly defined by their human capital The production and maintenance of human capital is our most important output Education Healthcare On the job training

6
People Have Been at the Center of Some of the Most Important Economic Developments of Our Lifetimes Increases in the return to education and skills have revolutionized labor markets and society Improvements in health and longevity have added as much value to peoples lives as have increases in material wealth Technological changes have increased the value of education outside of the workplace as well

7
The Rising Importance of Education (Based on Becker & Murphy 2007)
")
8
Education Wage Premiums

9
Education Premiums by Gender

10
Education Premiums by Race

11
Overall Rise in Wage Inequality for Men

12
Wage Growth by Percentile 1968-2004

13
Explaining Changes In Education Returns Using Supply & Demand Growth in the college premium can be explained by a very simple model Model based on Katz-Murphy 1992 The model: Demand grows steadily over time Fluctuations in supply cause education premiums to fluctuate Supply grows faster than demand premium falls Demand grows faster than supply premium rises

14
Supply Growth & Relative Wages

15
The Supply Response Growth in the college premium has generated a predictable response – more people have gone on to college

16
Wage Ratios & College Enrollment

18
Education & Gender (Becker Hubbard & Murphy 2010) While the fraction of individuals going on to college has increased over time the fraction graduating has not kept pace The most likely reason is that many students are not well prepared This is particularly true for young men As a result of this and other factors college graduation rates for men are falling behind those for women
 While the fraction of individuals going on to college has increased over time the fraction graduating has not kept pace The most likely reason is that many students are not well prepared This is particularly true for young men As a result of this and other factors college graduation rates for men are falling behind those for women")
19
College Graduation by Gender

20
Mean GPA of High School Graduates, High School Transcript Studies

21
DISTRIBUTION OF FIRST-YEAR UNDERGRADUATE GPA, BEGINNING POSTSECONDARY STUDENTS LONGITUDINAL STUDY

22
Education & the Household (Becker & Murphy 2008) Over time education has become more important in the household as well Education based differences in health and longevity have increased in recent decades More home based and out-patient care Increases in drug therapies and patient monitoring Education plays and important role in many other household activities Financial decision making Care and education of children
 Over time education has become more important in the household as well Education based differences in health and longevity have increased in recent decades More home based and out-patient care Increases in drug therapies and patient monitoring Education plays and important role in many other household activities Financial decision making Care and education of children")
23
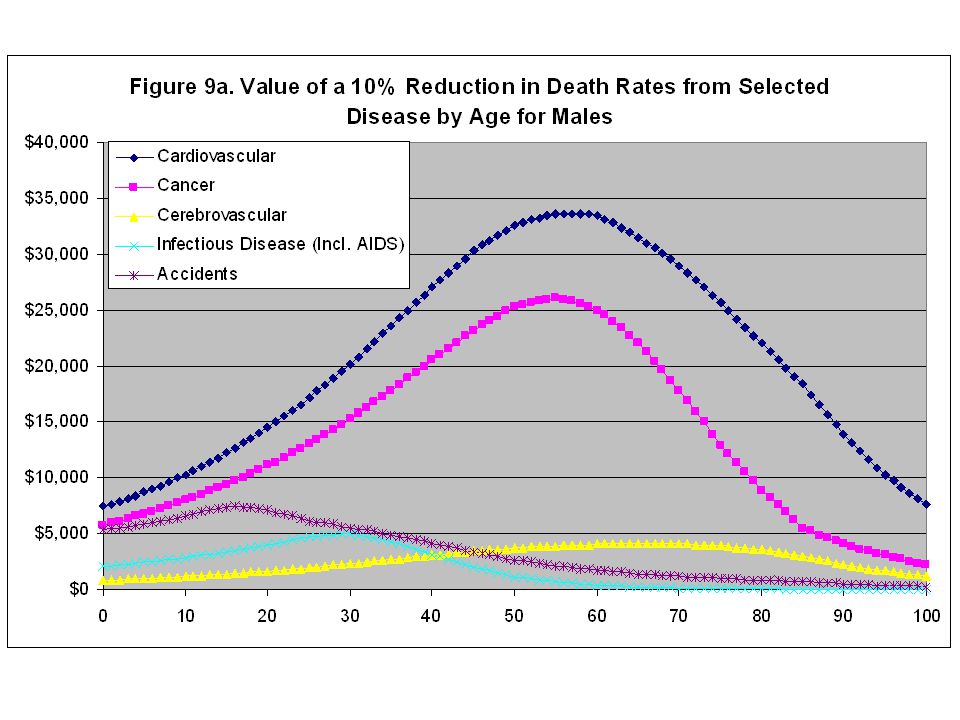
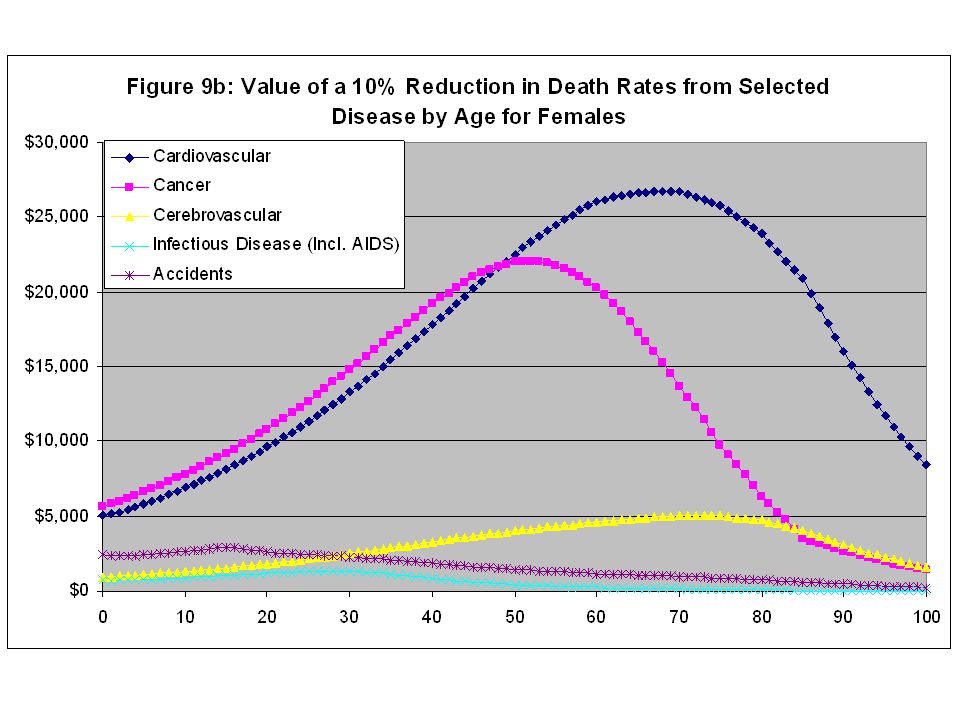
Improvements in Health (Based on Murphy & Topel 2007)
")
24
Basic Results Historical improvements in life expectancy have been very significant – improvements in longevity from 1970 to 2000 were worth roughly $95 trillion (or about $3.2 trillion per year) to U.S. citizens Improvements in life expectancy have contributed about as much to overall welfare as have improvements in material wealth

25
Basic Results (cont.) Potential future gains are also very large: A 10% reduction in cancer death rates is worth roughly $4.7 trillion to the U.S. alone Reducing cardiovascular disease deaths by 10% is worth roughly $5.7 trillion U.S. alone Worldwide benefits would be several multiples of that Even modest progress has great value: A 10% reduction in cancer deaths worth over $4.5 trillion Historical reduction in heart disease from 1970 to 2000 was worth about $35 trillion A 10% reduction in accident related deaths is worth about $1.4 trillion

26
The Value of Increased Longevity

27
Figure 3: Values of 1/10,000 Reduction in Death Rates $0 $100 $200 $300 $400 $500 $600 $700 $800 0102030405060708090100110 Age Value of a 1/10,000 Reduction In Death Rates

28
Extending the Model to Improvements in Health

29
Lifecycle Pattern of Health Implied by Consumption Data

30
Gains at The Individual Level

32
Aggregate Gains

33
Aggregate Gains from Increased Longevity 1970-2000 Aggregate Gains (Billions of $2004) 1970-19801980-19901990-201970-2000 Males$26,699$15,471$19,153$61,323 Females$20,515$9,067$4,440$34,022 Total$47,214$24,538$23,593$95,345
 Males$26,699$15,471$19,153$61,323 Females$20,515$9,067$4,440$34,022 Total$47,214$24,538$23,593$95,345")
35
Caveats to the Net Gains Analysis Gains include improvements from many margins not just health care Health care costs include many expenditures other than those directed at longevity However, the comparison allows us to compare the size of two important trends

36
Longer Term Changes Recent improvements are reflective of longer term gains in longevity Gains were actually somewhat greater in earlier decades using a fixed valuation profile (like fixed basis GNP accounting) Gains have become increasingly concentrated at older ages in recent decades
 Gains have become increasingly concentrated at older ages in recent decades")
38
Prospective Gains

41
Males Females Total $10,651$7,885$18,536 $3,254$2,471$5,725 $2,676$1,852$4,529 $393$460$852 $2,415$2,261$4,675 $847$557$1,404 $3$444$447 $301$302$603 $575$431 $1,006 $500$148$649 ALL CAUSES MAJOR CARDIOVASCULAR DISEASES DISEASES OF HEART CEREBROVASCULAR DISEASES MALIGNANT NEOPLASMS RESPIRATORY AND RELATED ORGANS BREAST REPRODUCTIVE AND URINARY ORGANS DIGESTIVE ORGANS INFECTIOUS DISEASES (Including AIDS) Gain from a Permanent 10% Reduction in Death Rates by Category of Disease (Billions of $2004)
 Gain from a Permanent 10% Reduction in Death Rates by Category of Disease (Billions of $2004)")
42
Gain from a Permanent 10% Reduction in Death Rates by Category of Disease (Billions of $2004) (Continued) Males Females Total
 (Continued) Males Females Total")
43
Important Policy Questions How do we take advantage of growing demand for education and skills? Increasing investment in higher education Improving education at lower levels How do we take advantage of potential gains from medical advance? Balancing the costs and benefits Improving insurance Talking advantage of scalable technologies and the world-wide growth in incomes

Similar presentations


 2.>")


 Household Taxes Factor services.>")


 – The increase in real GDP, which occurs over a period of.>")