Download presentation
Presentation is loading. Please wait.

1
Dr. Ron Lembke

2
Design maximizes product exposure to customers, profitability per square foot Decision variables Store flow pattern Allocation of (shelf) space to products Types Grid design Free-flow design Video
 space to products Types Grid design Free-flow design Video")
3
Office Carts Check- out Grocery Store MeatBread Milk

4
Feature Display Table Trans. Counter Apparel Store

9
“Prisoner” aisles make you enter store in a particular route, and pass by certain displays Often contain less profitable (for the store) brands “Decompression Zone” people walk past first rows of items before settling into shopping mode.
 brands Decompression Zone people walk past first rows of items before settling into shopping mode.")
10
Bakery, coffee shop, restaurant spread aromas by entrance to stimulate taste buds Siren song of the Starbucks (Safeway) Food samplers throughout store do same
 Food samplers throughout store do same")
11
Frequently purchased items at far sides of stores so you have to go through entire store (produce or meat). Profitable sections like produce placed where you keep running into them Colorful, fresh produce affects opinions about store Milk Meat Produce Bread

12
People follow perimeter pattern Sale items on end – everyone sees Half of a store’s profit comes from items on the perimeter Breakfast cereal brings in the most dollars per square foot Manufacturer incentives increase profitability of soft drinks “Anchors” at ends of a section: milk and butter at opposite ends of dairy case

13
Major items in middle of aisles so you have to walk down into middle of aisle (Cereal, peanut butter) ‘Power items’ on both sides of aisle so you have to look at both sides Cereal Peanut Butter
 ‘Power items’ on both sides of aisle so you have to look at both sides Cereal Peanut Butter")
14
End caps for high- visibility sale items Large quantities of inventory serve as “psychic stock” If there is a lot of it, it must be on sale Stimulates sales © 1995 Corel Corp.

15
Eliminate cross- over aisles? less wasted floor space, you have to look at more items, the more time you spend in the store, the more you buy. Who wants to read signs?

16
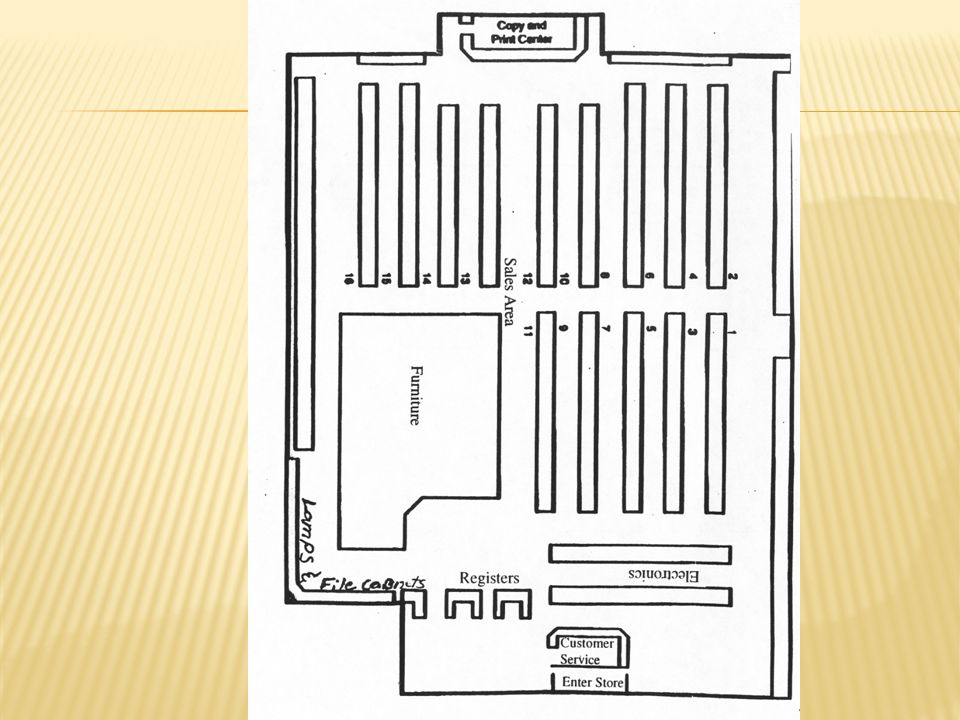
Shelves: 3.5x3.25 = 11.375 sq in. Store: 9*5.5 = 49.5 = 23% of store

17
Computerized tool for shelf-space management Generated from store’s scanner data on sales Often supplied by manufacturer Example: P&G 2 ft. 5 facings VO-5 SUAVE VO-5 PERT VO-5

18
Companies prefer to be at eye-level or at child- reaching level Close to leading brands or high-draw items: snack foods next to the peanut butter or across from the cereal: Lots of kids visit the area

19
Manufacturer pays retailer to get a product into a store 35,000 new grocery products per year Grocery stores often stock 30,000 items Impossible to evaluate all new products to choose the best new ones Slotting fees guarantee grocer profits on a product, help balance risk of trying unknown product. Grocery is a narrow margin business, slotting fees can represent a significant revenue source.

20
Senate Small Business Committee held hearings on them in 2000. Industry refused to cooperate with GAO. Growers of produce (not just brand names) now getting involved and complaining. Small businesses claim they can’t afford the big payments big companies can make. Advocates say small companies can “put their money where their mouths are” just like anyone else
 now getting involved and complaining. Small businesses claim they can’t afford the big payments big companies can make. Advocates say small companies can put their money where their mouths are just like anyone else.")
21
Retail layout types: grid, free-flowing Customer flow and most-frequently purchased items important considerations Human factors extremely important in retail layouts Buyer psychology, stimulate taste and smell No backtracking, Shelf position, as well as placement within store

Similar presentations


 Entrepreneurship I.>")


: What do you buy at a grocery store? What do you put your groceries in? Where do you keep your groceries when.>")


