Download presentation
Presentation is loading. Please wait.

1
Space-Time Scales in Oceanography and the LTER Sampling Strategy Raymond C. Smith Palmer LTER Site Review 1994

2
Palmer LTER Research Central Hypothesis: Interannual variations in physical processes, such as the extent of pack ice and oceanic circulation, affect all levels of the food web of the Southern Ocean.

3
Palmer LTER General Objectives Document interannual variability in the development and extent of annual pack ice as well as in the life-history parameters of primary producers and populations of key species from different trophic levels in the Antarctic marine food web; Quantify the processes that underlie natural variation in these representative populations; Construct models that link ecosystem processes to physical environmental variables, and that simulate the spatial/temporal relationships between representative populations; and Employ such models to predict and validate the impacts of altered periodicity’s in the annual extend of pack ice on ecosystem dynamics.

4
Space/Time Scales and Sampling Strategies in Oceanographic Research Conceptual framework to characterize space/time scales –identify important mechanisms –link tropic levels in context of space/time –significance of heterogeneity for ecosystem stability –increase reliability of sampling Palmer Grid and Sampling Strategy –match space/time scales of Palmer LTER –fixed geographic locations visited repeatedly over time –simplifies modeling computations –integrates space/time data from different scales Example as introduction to integrated data scheme

5
Antarctic LTER Space/Time Scales FIELD AREA[km2] Phytoplankton patch1x110^0 krill swarm1x1010^1 seabird forage50x5010^3 “near” field100x10010^4 AA Peninsula200x90010^5 Bellingshausen ice cover10^6 Southern Ocean ice cover10^7 FORCING/PROCESSES TIME[min] optical variabilitymin-hr10^-1 phytoplankton (diel)hrs10^1-10^3 seabird forage cycle2 days10^3 phytoplankton bloomdays10^3 episodic weatherh-d10^1-10^4 ice movementh-wks10^1-10^5 annual cycleyr5x10^5 life cycle krill/birdsyrs10^6
![Antarctic LTER Space/Time Scales FIELD AREA[km2] Phytoplankton patch1x110^0 krill swarm1x1010^1 seabird forage50x5010^3 near field100x10010^4 AA Peninsula200x90010^5 Bellingshausen ice cover10^6 Southern Ocean ice cover10^7 FORCING/PROCESSES TIME[min] optical variabilitymin-hr10^-1 phytoplankton (diel)hrs10^1-10^3 seabird forage cycle2 days10^3 phytoplankton bloomdays10^3 episodic weatherh-d10^1-10^4 ice movementh-wks10^1-10^5 annual cycleyr5x10^5 life cycle krill/birdsyrs10^6](http://images.slideplayer.com/13/4090534/slides/slide_5.jpg "Antarctic LTER Space/Time Scales FIELD AREA[km2] Phytoplankton patch1x110^0 krill swarm1x1010^1 seabird forage50x5010^3 near field100x10010^4 AA Peninsula200x90010^5 Bellingshausen ice cover10^6 Southern Ocean ice cover10^7 FORCING/PROCESSES TIME[min] optical variabilitymin-hr10^-1 phytoplankton (diel)hrs10^1-10^3 seabird forage cycle2 days10^3 phytoplankton bloomdays10^3 episodic weatherh-d10^1-10^4 ice movementh-wks10^1-10^5 annual cycleyr5x10^5 life cycle krill/birdsyrs10^6")
6
Physiography of the Arctic Basin and the waters around the Antarctic continent.

7
Characteristic Zones of the Southern Ocean Large-scale circulation of the Southern Ocean showing five zones recommended for study within the US JGOFS Southern Ocean process study. [redrawn from Lutjeharms et al. (1985)]
].")
10
A very simplified representation of typical time and space scales associated with plants (P), herbivorous zooplankton (Z) and pelagic fish (F). [Steele, 1978]

11
An indication of the space and time scales covered by various types of sampling programs. [Steele, 1978]

12
The Stommel Diagram, a conceptual model of the time-space scales of zooplankton biomass variability and the factors contributing to these scales. [Haury, McGowan and Wiebe]

13
Scales of Plankton Patterns Haury, McGowan and Wiebe

14
Phytoplankton Patches a “patchy” distribution is one for which the ratio of the variance to the mean is far greater than would be expected if individual organisms were positioned randomly within the sampled region –loss of organisms due to diffusion through boundary = circumference=2*pi*r –gain through reproduction = area patch = pi*r*r –diffusion/reproduction ~ 1/r as size of a water mass decreases, diffusion is relatively more important and eventually a limit is reached beyond which reporduction can no longer compensate for the loss due to diffusion

17
Space/Time Domains of Oceanographic Research Platforms

18
Space/Time Scales of Phytoplankton Variability Of interest per se A central component in dynamical biological oceanography to –characterize scales descriptively under different environmental conditions –identify mechanisms leading to space/time variability in phytoplankton populations –understand the proximal determinants of phytoplankton growth and the linkages of this growth to high tropic levels –understand the significance of this heterogeneity in terms of the stability of the ecosystem –understand the fundamental variability of the ocean environment in order to increase the reliability of sampling

19
Schematic Power Spectra for the Horizontal Variability of Chlorophyll [Smith, Zhang, Michaelsen, 1988]
![Schematic Power Spectra for the Horizontal Variability of Chlorophyll [Smith, Zhang, Michaelsen, 1988]](http://images.slideplayer.com/13/4090534/slides/slide_19.jpg "Schematic Power Spectra for the Horizontal Variability of Chlorophyll [Smith, Zhang, Michaelsen, 1988]")
22
Palmer LTER Grid Facilitates integration of spatial data acquired at different scales and times, and in different formats: –Measure environmental parameters –Map abundance and distribution –Monitor changes in space/time –Model processes on range of space/time scales Objectives of an integrated data scheme: –data acquisition (identify and gather required data) –preprocessing (manipulate data into useable forms) –data-management (creation of and access to the database) –manipulation and analysis (analytic operations in database) –product generation (final copy: graphic/digital/hard)
 –preprocessing (manipulate data into useable forms) –data-management (creation of and access to the database) –manipulation and analysis (analytic operations in database) –product generation (final copy: graphic/digital/hard)")
23
EXAMPLES Works in Progress related to the space/ time sampling strategy Sampling near the LTER area Bio-Optical Models of Oceanic Primary Productivity Net Primary Productivity

28
Global and Regional Oceanographic Net Primary Productivity from Satellite Derived Data PAR is calculated using a daabase from the International Satellite Cloud Climatology Program (ISCCP) –presence of land –precipitable water –cloud fraction –cloud reflection –temperature –satellite viewing angle Chlorophyll (CZCS pigment biomass) –Univ of Miami –Goddard Space Flight Center –Gene Feldman
 –presence of land –precipitable water –cloud fraction –cloud reflection –temperature –satellite viewing angle Chlorophyll (CZCS pigment biomass) –Univ of Miami –Goddard Space Flight Center –Gene Feldman")
29
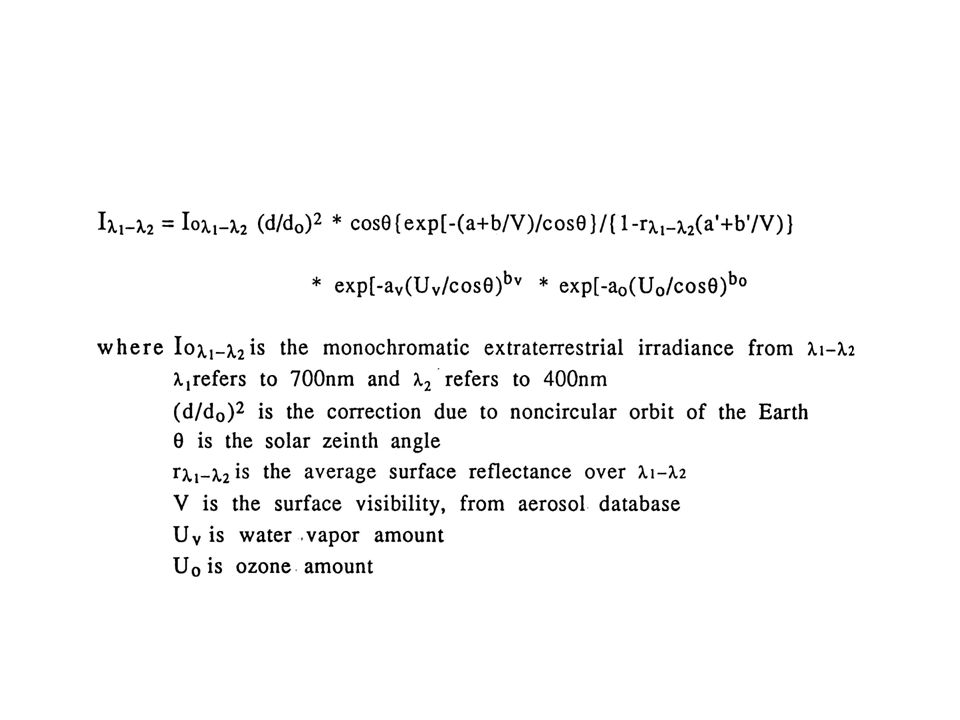
Summary of Uncertainties

Similar presentations


>")


 that will.>")

 A demonstration space mission dedicated to land surface environment (Vegetation and Environment New.>")


