Download presentation
Presentation is loading. Please wait.

2
The Scientific Method involves a series of steps that are used to investigate a natural occurrence.

3
We shall take a closer look at these steps and the terminology you will need to understand before you start a science project.

4
Problem/Question Observation/Research Formulate a Hypothesis Experiment Collect and Analyze Results Conclusion Communicate the Results

5
Steps of the Scientific Method Problem/Question 1. Problem/Question: Develop a question or problem that can be solved through experimentation.

6
Steps of the Scientific Method Observation/Research 2. Observation/Research: Make observations and research your topic of interest.

7
Do you remember the next step?

8
Steps of the Scientific Method Formulate a Hypothesis 3. Formulate a Hypothesis: Predict a possible answer to the problem or question. Example: If soil temperatures rise, then plant growth will increase.

9
Steps of the Scientific Method Experiment 4. Experiment: Develop and follow a procedure. Include a detailed materials list. The outcome must be measurable (quantifiable).
..")
10
10 Scientific Method - Controls and Variables

11
11 Scientific Experiments Follow Rules. An experimenter changes one factor and observes or measures what happens.

12
12 The Control Variable The experimenter makes a special effort to keep other factors constant so that they will not effect the outcome. The experimenter makes a special effort to keep other factors constant so that they will not effect the outcome. Those factors are called control variables. Those factors are called control variables.

13
13 What is the Purpose of a Control? Controls are NOT being tested Controls are used for COMPARISON

14
14 Other Variables The factor that is changed is known as the independent variable. The factor that is measured or observed is called the dependent variable.

15
15 Example of Controls & Variables For example, suppose you want to figure out the fastest route to walk home from school. You will try several different routes and time how long it takes you to get home by each one. Since you are only interested in finding a route that is fastest for you, you will do the walking yourself.

16
16 What are the Variables in Your Experiment? Varying the route is the independent variable Varying the route is the independent variable The time it takes is the dependent variable The time it takes is the dependent variable Keeping the same walker throughout makes the walker a control variable. Keeping the same walker throughout makes the walker a control variable.

17
17 One more thing… it is best to make several trials with each independent variable.

18
Steps of the Scientific Method Collect and Analyze Results 5. Collect and Analyze Results: Modify the procedure if needed. Confirm the results by retesting. Include tables, graphs, and photographs.

19
Graphs Graphs are often an excellent way to display your results. In fact, most good science fair projects have at least one graph. For any type of graph: Generally, you should place your independent variable on the x-axis of your graph and the dependent variable on the y-axis. Be sure to label the axes of your graph— don't forget to include the units of measurement (grams, centimeters, liters, etc.). If you have more than one set of data, show each series in a different color or symbol and include a legend with clear labels.
. If you have more than one set of data, show each series in a different color or symbol and include a legend with clear labels..")
20
Different types of graphs are appropriate for different experiments. These are just a few of the possible types of graphs

21
A bar graph might be appropriate for comparing different trials or different experimental groups. It also may be a good choice if your independent variable is not numerical. (In Microsoft Excel, generate bar graphs by choosing chart types "Column" or "Bar.")
.")
22
A time-series plot can be used if your dependent variable is numerical and your independent variable is time. (In Microsoft Excel, the "line graph" chart type generates a time series. By default, Excel simply puts a count on the x-axis. To generate a time series plot with your choice of x-axis units, make a separate data column that contains those units next to your dependent variable. Then choose the "XY (scatter)" chart type, with a sub-type that draws a line.)
 chart type, with a sub-type that draws a line.).")
23
An xy-line graph shows the relationship between your dependent and independent variables when both are numerical and the dependent variable is a function of the independent variable. (In Microsoft Excel, choose the "XY (scatter)" chart type, and then choose a sub-type that does draw a line.)
 chart type, and then choose a sub-type that does draw a line.).")
24
A scatter plot might be the proper graph if you're trying to show how two variables may be related to one another. (In Microsoft Excel, choose the "XY (scatter)" chart type, and then choose a sub-type that does not draw a line.)
 chart type, and then choose a sub-type that does not draw a line.).")
25
AA Batteries Tested in a Flashlight Energizer Brand AA Batteries Battery ##3#4 #19#20 #31#32 Time (hour)Voltage Flashlight dea d? Voltage Flashlight dea d? Voltage Flashlight dea d? Average Volt age 0.01.6051.610 1.6071.609 1.6041.605 1.607 0.5 1.3961.402 1.4001.412 1.403 1.01.3561.363 1.3431.351 1.3541.360 1.355 1.5 1.3071.314 1.3181.327 1.317 2.01.295 1.2801.288 1.3041.311 1.296 2.51.2731.280 1.2671.284 1.2681.278 1.275 3.01.2601.265 1.2551.262 1.2611.267 1.262 3.51.2491.256 1.2451.247 1.252 1.249 4.0 1.2261.232 1.2301.238 1.232 4.51.2211.226 1.2061.216 1.2121.224 1.218 5.0 1.1971.204 1.1961.210 1.202 5.51.1601.186 1.1701.178 1.1771.190 1.177 6.0 1.1281.150 1.1741.184 1.159 6.51.1081.135 1.0851.117 1.1321.144 1.120 7.00.6301.120Yes1.0121.063 1.1251.137 1.015 7.5 0.5150.586Yes1.0631.095 0.815 8.0 0.6090.900Yes0.755

26
Time (the independent variable) is on the x-axis of the graph. Voltage (the dependent variable) is on the y-axis of the graph.
 is on the y-axis of the graph..")
27
Data Analysis Checklist What Makes for a Good Data Analysis Chart?For a Good Chart, You Should Answer "Yes" to Every QuestionIs there sufficient data to know whether your hypothesis is correct? Yes / No. Is your data accurate? Yes / No. Have you summarized your data with an average, if appropriate? Yes / No. Does your chart specify units of measurement for all data? Yes / No. Have you verified that all calculations (if any) are correct? Yes / No
 are correct. Yes / No.")
28
What Makes for a Good Graph?For a Good Graph, You Should Answer "Yes" to Every Question: Have you selected the appropriate graph type for the data you are displaying? Yes / No. Does your graph have a title? Yes / No. Have you placed the independent variable on the x-axis and the dependent variable on the y- axis? Yes / No. Have you labeled the axes correctly and specified the units of measurement? Yes / No. Does your graph have the proper scale (the appropriate high and low values on the axes)? Yes / No. Is your data plotted correctly and clearly? Yes / No
. Yes / No. Is your data plotted correctly and clearly. Yes / No.")
29
Steps of the Scientific Method Conclusion 6. Conclusion: CLAIM, EVIDENCE, REASONING--Include a statement that accepts or rejects the hypothesis. Make recommendations for further study and possible improvements to the procedure.

30
Steps of the Scientific Method Communicate the Results 7. Communicate the Results: Be prepared to present the project to an audience. Expect questions from the audience.

31
Think you can name all seven steps? Problem/Question Observation/Research Formulate a Hypothesis Experiment Collect and Analyze Results Conclusion Communicate the Results

32
Let’s put our knowledge of the Scientific Method to a realistic example that includes some of the terms you’ll be needing to use and understand.

33
Problem/Question Coach Bostick watches his grandmother bake bread. He ask his grandmother what makes the bread rise. She explains that yeast releases a gas as it feeds on sugar.

34
Problem/Question Coach Bostick wonders if the amount of sugar used in the recipe will affect the size of the bread loaf?

35
Caution! Be careful how you use effect and affect. Effect is usually a noun and affect, a verb. “ The effect of sugar amounts on the rising of bread.” “How does sugar affect the rising of bread?”

36
Observation/Research Coach Bostick researches the areas of baking and fermentation and tries to come up with a way to test his question. He keeps all of his information on this topic in a journal.

37
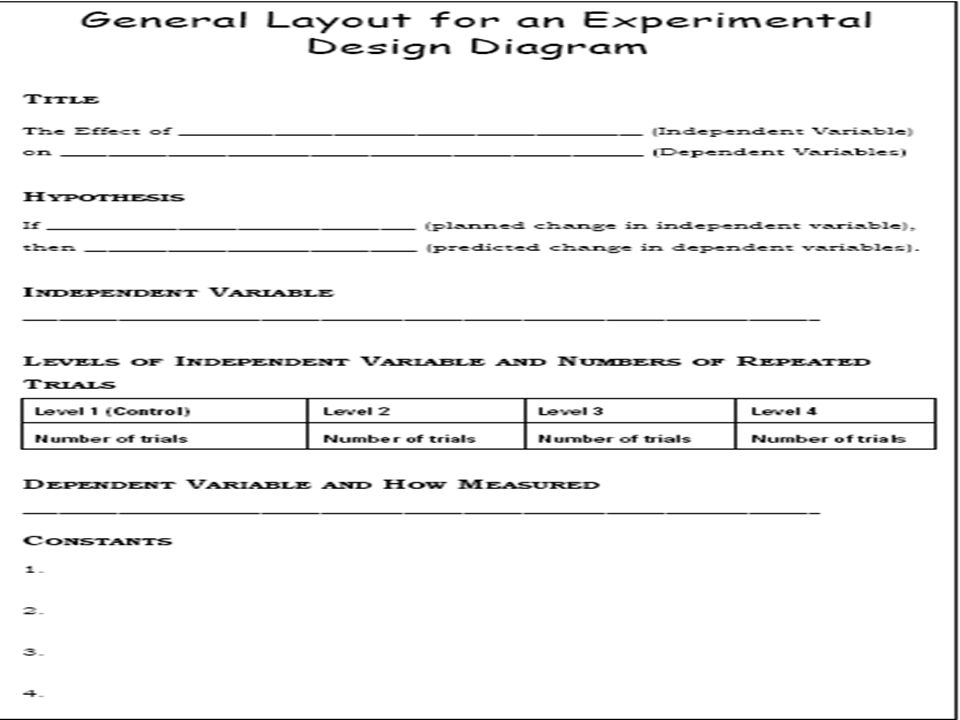
Coach Bostick talks with his teacher and she gives him a Experimental Design Diagram to help him set up his investigation.

39
Formulate a Hypothesis After talking with his teacher and conducting further research, he comes up with a hypothesis. “If more sugar is added, then the bread will rise higher.”

40
Hypothesis The hypothesis is an educated guess about the relationship between the independent and dependent variables. Note: These variables will be defined in the next few slides.

41
Do you know the difference between the independent and dependent variables?

42
Experiment His teacher helps him come up with a procedure and list of needed materials. She discusses with Coach Bostick how to determine the control group.

43
Control Group In a scientific experiment, the control is the group that serves as the standard of comparison. The control group may be a “no treatment" or an “experimenter selected” group.

44
Control Group The control group is exposed to the same conditions as the experimental group, except for the variable being tested. All experiments should have a control group.

45
Control Group Because his grandmother always used 50g. of sugar in her recipe, Coach Bostick is going to use that amount in his control group.

46
Constants Coach Bostick’s teacher reminds him to keep all other factors the same so that any observed changes in the bread can be attributed to the variation in the amount of sugar.

47
Constants The constants in an experiment are all the factors that the experimenter attempts to keep the same.

48
Can you think of some constants for this experiment?

49
Constants They might include: Other ingredients to the bread recipe, oven used, rise time, brand of ingredients, cooking time, type of pan used, air temperature and humidity where the bread was rising, oven temperature, age of the yeast…

50
Experiment Coach Bostick writes out his procedure for his experiment along with a materials list in his journal. He has both of these checked by his teacher where she checks for any safety concerns.

51
Trials Trials refer to replicate groups that are exposed to the same conditions in an experiment. Coach Bostick is going to test each sugar variable 3 times.

52
Collect and Analyze Results Coach Bostick comes up with a table he can use to record his data. Coach Bostick gets all his materials together and carries out his experiment.

53
Size of Baked Bread (LxWxH) cm 3 Amt. of Sugar (g.) 123Average Size (cm 3 ) 25768744761758 501296118812961260 10011881080 1116 250672576588612 500432504360432 Size of Bread Loaf (cm 3 ) Trials Control group
 123Average Size (cm 3 ) Size of Bread Loaf (cm 3 ) Trials Control group.")
54
Collect and Analyze Results Coach Bostick examines his data and notices that his control worked the best in this experiment, but not significantly better than 100g. of sugar.

55
Conclusion Coach Bostick rejects his hypothesis, but decides to re-test using sugar amounts between 50g. and 100g.

56
Experiment Once again, Coach Bostick gathers his materials and carries out his experiment. Here are the results.

57
Can you tell which group did the best?

58
Size of Baked Bread (LxWxH) cm 3 Amt. of Sugar (g.) 123Average Size (cm 3 ) 501296144012961344 601404129614401380 701638 15601612 8014041296 1332 90108012009721084 Size of Bread Loaf (cm 3 ) Trials Control group
 123Average Size (cm 3 ) Size of Bread Loaf (cm 3 ) Trials Control group.")
59
Conclusion Coach Bostick finds that 70g. of sugar produces the largest loaf. His hypothesis is accepted.

60
Communicate the Results Coach Bostick tells his grandmother about his findings and prepares to present his project in Science class.

62
62 Scientific Method - Controls and Variables

63
63 Scientific Experiments Follow Rules. An experimenter changes one factor and observes or measures what happens.

64
64 The Control Variable The experimenter makes a special effort to keep other factors constant so that they will not effect the outcome. The experimenter makes a special effort to keep other factors constant so that they will not effect the outcome. Those factors are called control variables. Those factors are called control variables.

65
65 What is the Purpose of a Control? Controls are NOT being tested Controls are used for COMPARISON

66
66 Other Variables The factor that is changed is known as the independent variable. The factor that is measured or observed is called the dependent variable.

67
67 Example of Controls & Variables For example, suppose you want to figure out the fastest route to walk home from school. You will try several different routes and time how long it takes you to get home by each one. Since you are only interested in finding a route that is fastest for you, you will do the walking yourself.

68
68 What are the Variables in Your Experiment? Varying the route is the independent variable Varying the route is the independent variable The time it takes is the dependent variable The time it takes is the dependent variable Keeping the same walker throughout makes the walker a control variable. Keeping the same walker throughout makes the walker a control variable.

69
69 One more thing… it is best to make several trials with each independent variable.

70
70

Similar presentations