Download presentation
Presentation is loading. Please wait.

1
AP Human Geography Key Issue 2-3
Why Is Population Increasing at Different Rates in Different Countries?

2
Variations in Population Growth
The Demographic Transition 1. Low growth – 3. Moderate growth 2. High growth – 4. Low growth Population pyramids Age distribution Sex ratio Countries in different stages of demographic transition Demographic transition and world population growth

3
What is the Demographic Transition?
The shift from high to low mortality and fertility through four distinct stages. Based on the experience of Western Europe’s Industrial Age. Began by Warren Thompson in 1929. Further developed in 1945 by Frank Notestein A sign of socio-economic progress? The shift from high mortality and fertility to low mortality and fertility is known as the “demographic transition.” It is based on the experience of Western Europe, in particular England and Wales. This model was first described by the American demographer Warren Thompson in 1929. In 1945, Frank W. Notestein further developed this theory and suggested that there was a relationship between population change and industrialization. A debate continues questioning if population growth must decline for economic development or if economic progress (or industrialization) leads to slower population growth. In light of this debate, the completion of the demographic transition has come to be associated with socioeconomic progress. [FYI – The factors that drive childbearing trends—such as the economy, education, gender relations, and access to family planning—are numerous and complex. These same factors are signs of socioeconomic development.]
 leads to slower population growth. In light of this debate, the completion of the demographic transition has come to be associated with socioeconomic progress. [FYI – The factors that drive childbearing trends—such as the economy, education, gender relations, and access to family planning—are numerous and complex. These same factors are signs of socioeconomic development.]")
4
The Demographic Transition
Stage 1: Low Growth Stage 4: Low Growth or Stationary Very high CBR Very low CBR Very high CDR Low, slightly increasing CDR Very low NIR Zero or negative NIR Stage 2: High Growth High CBR Stage 5?: Stationary population level (SPL)? Rapidly declining CDR Very high NIR Stage 3: Moderate Growth Rapidly declining CBR Moderately declining CDR Moderate NIR
 Rapidly declining CDR. Very high NIR. Stage 3: Moderate Growth. Rapidly declining CBR. Moderately declining CDR. Moderate NIR.")
5
In Depth New Model

6
Stage 1 - High Fluctuating
Birth Rate and Death rate are both high. Population growth is slow and fluctuating. Reasons Birth Rate is high as a result of: Lack of family planning High Infant Mortality Rate: putting babies in the 'bank' Need for workers in agriculture Religious beliefs Children as economic assets Death Rate is high because of: High levels of disease Famine Lack of clean water and sanitation Lack of health care War Competition for food from predators such as rats Lack of education Typical of Britain in the 18th century and the Least Economically Developed Countries (LEDC's) today.
 today.")
7
In Depth New Model

8
Stage 2 - Early Expanding
Birth Rate remains high. Death Rate is falling. Population begins to rise steadily. Reasons Death Rate is falling as a result of: Improved health care (e.g. Smallpox Vaccine) Improved Hygiene (Water for drinking boiled) Improved sanitation Improved food production and storage Improved transport for food Decreased Infant Mortality Rates Typical of Britain in 19th century; Bangladesh; Nigeria
 Improved Hygiene (Water for drinking boiled) Improved sanitation. Improved food production and storage. Improved transport for food. Decreased Infant Mortality Rates. Typical of Britain in 19th century; Bangladesh; Nigeria.")
9
In Depth New Model

10
Stage 3 - Late Expanding Birth Rate starts to fall. Death Rate continues to fall. Population rising. Reasons: Family planning available Lower Infant Mortality Rate Increased mechanization reduces need for workers Increased standard of living Changing status of women Typical of Britain in late 19th and early 20th century; China; Brazil.

11
In Depth New Model

12
Stage 4 - Low Fluctuating
Birth Rate and Death Rate both low. Population steady. Economy is settled Fully developed Middle Class Political stability Typical of USA; Sweden; Japan; Britain

13
In Depth New Model

14
Stage 5? – Declining Population
Theoretical Death Rate exceeds Birth Rate. Negative NIR Mostly Eastern European Countries Russia Belarus Germany Italy Japan Many developed countries are predicted to experience population decline. Factor of more elderly than young population in these countries Fewer young women who will be entering their childbearing years Elderly Support Ratio - The number of working-age people (ages 15–64) divided by the number of persons 65 or older
 divided by the number of persons 65 or older.")
15
ELDERLY SUPPORT RATIO © 2013 Pearson Education, Inc.

16
Chapter 2, Figure 2.7.3

17
Chapter 2, Figure 2.7.4

18
Is the Demographic Transition Model Still Useful?
How well does the classic model work? Is it a useful framework for developing countries? Do developing countries need to share the experiences of Europe and the United States? Is the socioeconomic change experienced by industrialized countries a prerequisite or a consequence of demographic transition? [To prepare for this discussion, read pages 3-11 in the Population Reference Bureau’s Population Bulletin on “Transitions in World Population.” March 2004] How well does the classic model work? Is the Demographic Transition Model useful as a framework for evaluating demographic change in regions outside Europe and the U.S.? [A: There are significant and sometimes complex variances to the model, whether due to economic chaos (e.g. Russia), disease (South Africa), or continued population growth (Congo), yet the model is still useful as a guide and as a standard of comparison.] Is it necessary that all countries share the experiences of Europe and the United States in order to pass through a demographic transition? [A: Participants may raise questions related to women’s rights or cultural values (religion) as other important factors. All countries must not necessarily share the same experiences of Europe and the USA, but in some way economic opportunities must be available to all (men and women, as well as all, if not most ethnic/racial groups) for a country to complete the Demographic Transition.] Is the socioeconomic change experienced by industrialized countries a prerequisite or a consequence of demographic transition? Are there multiple ways to achieve a similar end? This is a question of ongoing debate.
, disease (South Africa), or continued population growth (Congo), yet the model is still useful as a guide and as a standard of comparison.] Is it necessary that all countries share the experiences of Europe and the United States in order to pass through a demographic transition [A: Participants may raise questions related to women’s rights or cultural values (religion) as other important factors. All countries must not necessarily share the same experiences of Europe and the USA, but in some way economic opportunities must be available to all (men and women, as well as all, if not most ethnic/racial groups) for a country to complete the Demographic Transition.] Is the socioeconomic change experienced by industrialized countries a prerequisite or a consequence of demographic transition Are there multiple ways to achieve a similar end This is a question of ongoing debate.")
19
Is the model universally applicable?
Like all models, the demographic transition model has its limitations. It failed to consider, or to predict, several factors and events: 1 Birth rates in several MDCs have fallen below death rates (Germany, Sweden). This has caused, for the first time, a population decline which suggests that perhaps the model should have a fifth stage added to it. 2 The model assumes that in time all countries pass through the same four stages. It now seems unlikely, however, that many LDCs, especially in Africa, will ever become industrialized.
. This has caused, for the first time, a population decline which suggests that perhaps the model should have a fifth stage added to it. 2 The model assumes that in time all countries pass through the same four stages. It now seems unlikely, however, that many LDCs, especially in Africa, will ever become industrialized.")
20
3 The model assumes that the fall in the death rate in Stage 2 was the consequence of industrialization. In many countries, the fall in the birth rate in Stage 3 has been less rapid than the model suggests due to religious and/or political opposition to birth control (Brazil), whereas the fall was much more rapid, and came earlier, in China following the government-introduced ‘one child’ policy. The timescale of the model, especially in several South-east Asian countries such as Hong Kong and Malaysia, is being squashed as they develop at a much faster rate than did the early industrialized countries. 4 Countries that grew as a consequence of emigration from Europe (USA, Canada, Australia) did not pass through the early stages of the model.
 did not pass through the early stages of the model.")
21
Population Pyramid

22
Population Pyramids = graphic device that represents a population’s age and sex composition.
Pyramid describes diagram’s shape for many countries in 1800’s when was created.

23
Population Pyramid Overview
The most important demographic characteristic of a population is its age-sex structure. Age-sex pyramids (also known as population pyramids) graphically display this information to improve understanding and ease comparison. Age-sex pyramids display the percentage or actual amount of a population broken down by gender and age. The five-year age increments on the y-axis allow the pyramid to vividly reflect long term trends in the birth and death rates but also reflect shorter term baby-booms, wars, and epidemics.
 graphically display this information to improve understanding and ease comparison. Age-sex pyramids display the percentage or actual amount of a population broken down by gender and age. The five-year age increments on the y-axis allow the pyramid to vividly reflect long term trends in the birth and death rates but also reflect shorter term baby-booms, wars, and epidemics.")
24
Population Pyramids The shape of a pyramid is primarily determined by the crude death rate in the community. Dependency ratio-the number of people who are too young or too old to work, compared to the number of people in their productive years. People who are 0-14 and 65-plus normally are classified as dependents. The “graying” of a population refers to the aging of a community. Population pyramids also foretell future problems from present population policies or practices. Ex. China’s population policies skewed in favor of males.

25
Dependency ratio Number of people who are too young or too old to work, compared to the number of people in their productive years Indicates financial burden on a society’s productive population Dependency Ratio = measure of # of dependents – old and young that each 100 people in productive years (15 – 64) © 2013 Pearson Education, Inc.
 © 2013 Pearson Education, Inc.")
26
Sex Ratio The number of males per hundred females in the population is the sex ratio. In Europe and North America the ratio of men to women is about 95:100 In poorer countries the high mortality rate during childbirth partly explains the lower percentage of women.

27
There are three key types of population pyramids:
Rapid Growth: This pyramid of the Philippines shows a triangle-shaped pyramid and reflects a high growth rate of about 2.1 percent annually.

28
There are three key types of population pyramids:
Slow Growth: In the United States, the population is growing at a rate of about 1.7 percent annually. This growth rate is reflected in the more square-like structure of the pyramid. Note the lump in the pyramid between the ages of about 35 to 50.

29
In wealthy countries with very slow rate of population growth – population is nearly equally divided - so pyramids have Almost vertical sides. War can be reflected by showing depleted age cohorts and male – female disparities. The % of a country’s population in each age group strongly influences demand for goods and services within that national economy. Country with high % of young has high demand for educational facilities and health delivery services.

30
There are three key types of population pyramids:
Negative Growth: Germany is experiencing a period of negative growth (-0.1%). As negative growth in a country continues, the population is reduced. A population can shrink due to a low birth rate and a stable death rate. Increased emigration may also be a contributor to a declining population.
. As negative growth in a country continues, the population is reduced. A population can shrink due to a low birth rate and a stable death rate. Increased emigration may also be a contributor to a declining population.")
31
Population Pyramids in U.S. cities
: Population pyramids can vary greatly with different fertility rates (Laredo vs. Honolulu), or among military bases (Unalaska), college towns (Lawrence), Fig. 2-16and retirement communities (Nples).
, or among military bases (Unalaska), college towns (Lawrence), Fig. 2-16and retirement communities (Nples).")
32
Countries In Different Stages of Demographic Transition

33
Rapid Growth in Cape Verde
Fig. 2-17: Cape Verde, which entered stage 2 of the demographic transition in about 1950, is experiencing rapid population growth. Its population history reflects the impacts of famines and out-migration.

34
Moderate Growth in Chile
Fig. 2-18: Chile entered stage 2 of the demographic transition in the 1930s, and it entered stage 3 in the 1960s.

35
Low Growth in Denmark Fig. 2-19: Denmark has been in stage 4 of the demographic transition since the 1970s, with little population growth since then. Its population pyramid shows increasing numbers of elderly and few children.

36
2.5 The Demographic Transition
POPULATION PYRAMID AND DEMOGRAPHIC TRANSITION FOR CAPE VERDE (LEFT), CHILE (CENTER), DENMARK (RIGHT) © 2013 Pearson Education, Inc.
, CHILE (CENTER), DENMARK (RIGHT) © 2013 Pearson Education, Inc.")
37
Census taking in China

38
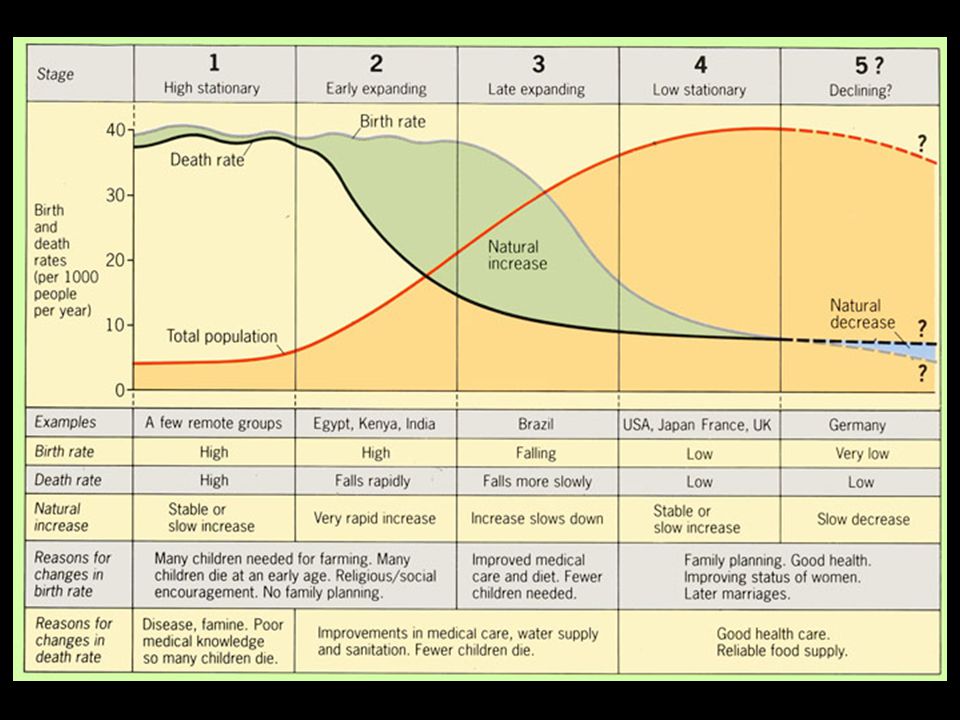
Demographic Transition and World Population Growth
How many countries are in each of the following stages of the demographic transition? Stage 1- None Stage 2 and 3- majority of countries (i.e. Egypt, Kenya, India) Stage 4- USA, Japan, France, UK Stage 5 – Germany?
 Stage 4- USA, Japan, France, UK. Stage 5 – Germany")
39
Two “big breaks” & their causes
The first break-the sudden drop in the death rate that comes from technological innovation The second break-sudden drop in the birth rate that comes from changing social customs

Similar presentations


>")


