Download presentation
Presentation is loading. Please wait.

1
Evidence-Based Diagnosis Part I: Introduction to diagnosis Mark H. Ebell MD, MS Associate Professor Dept of Epidemiology and Biostatistics Co-Director, Institute for Evidence- Based Health Professions Education College of Public Health University of Georgia

2
Disclosure Editor-in-Chief, Essential Evidence Plus, www.essentialevidence.com (Wiley-Blackwell) Deputy Editor, American Family Physician (American Academy of Family Physicians) Co-Editor, Essentials of Family Medicine (Lippincott Williams and Wilkins) Member, United States Preventive Services Task Force
 Deputy Editor, American Family Physician (American Academy of Family Physicians) Co-Editor, Essentials of Family Medicine (Lippincott Williams and Wilkins) Member, United States Preventive Services Task Force")
3
Objectives Key tasks when teaching diagnosis What is the differential diagnosis? What is the pretest probability? How do I make best use of the history and physical? How do I select and interpret diagnostic tests?

4
My background in technology Formal education Age 15, Fortran IV class at Delta Community College (punch cards) Informal education Basic, Pascal, Visual Basic, NewtonScriptand computer languages FamilyMD shareware program (1991-3) One of first Web sites for medical journal (1993) First medical application for Apple Newton (1996) Founded InfoPOEMs 1998, developed InfoRetriever, purchased by Wiley Blackwell 2006, now Essential Evidence Programmed Newton, Windows CE, and desktop versions of software Currently editor and software architect for Essential Evidence
 Informal education Basic, Pascal, Visual Basic, NewtonScriptand computer languages FamilyMD shareware program (1991-3) One of first Web sites for medical journal (1993) First medical application for Apple Newton (1996) Founded InfoPOEMs 1998, developed InfoRetriever, purchased by Wiley Blackwell 2006, now Essential Evidence Programmed Newton, Windows CE, and desktop versions of software Currently editor and software architect for Essential Evidence")
5
What is a diagnostic test? A question about a symptom: "Have you had a fever?" or "Is your chest pain worse with exercise?" A physical sign such as swollen glands or crackles in the lungs A blood, urine, or stool study An imaging study such as ultrasound, CT, MRI, or x-ray An invasive study such as colonoscopy or catheterization Combinations of the above called "clinical decision rules" or "clinical prediction rules"

6
What are the steps in the diagnostic process? 1.Determine the differential diagnosis 2.Use the history and physical examination to modify the likelihood of each diagnosis 3.Use office-based diagnostic tests to modify the likelihood of each diagnosis 4.Use other diagnostic tests if needed to rule in or rule out important diagnoses For example, consider diagnosis of influenza: Pretest probability History and physical Diagnostic tests Influenza ruled in or out

7
Ruling in and ruling out disease: "Threshold Model" The "Threshold Model" was developed by Stephen Pauker and Jerome Kassirer in the 1980's It provides a framework for thinking about diagnosis: When can I stop ordering tests, and "rule out" a diagnosis? When should I stop ordering tests, and begin treatment? A challenge of evidence-based practice is to move from implicit to explicit decision-making 0%100% Test threshold Treatment threshold Do nothingMore information neededTreat

8
Example: Rapid test for influenza Let's say that if we are more than 60% sure a patient has the flu, we would make the diagnosis and begin treatment. On the other hand, if the probability was less than 10%, we would no longer worry about it, especially since it is typically a self-limited condition. That situation would look like this: 0%100% Test threshold Treatment threshold Flu ruled out Need more infoTreat for flu 10%60%

9
Example: Rapid test for influenza During the middle of flu season, a patient comes in possible flu-like symptoms The overall chance that they actually have flu before you learn anything more about them is the "pretest probability" and is about 30% What can we learn from the rapid flu test? 0%100% Test threshold Treatment threshold Flu ruled out Need more infoTreat for flu 10%60% 30%

10
Example: Rapid test for influenza Given a pretest probability of 30% (typical in flu season): If the test is positive, the probability of flu increases to 84% If the test is negative, the probability of flu decreases to 8% These values are "post-test probabilities" and depend on three things: the pretest probability, and the sensitivity and specificity of the test. More on that later! 0%100% Test threshold Treatment threshold Flu ruled out Need more infoTreat for flu 10%60% 30% 84%8%

11
Example: Rapid test for influenza What if the patient has fever, cough, acute onset, and body aches, increasing their pretest probability to 56%? Because the starting point has changed, the new post-test probabilities are: If the test is positive, the probability of flu increases to 95% If the test is negative, the probability of flu decreases to 25% Now, a negative test does not help you! 0%100% Test threshold Treatment threshold Flu ruled out Need more infoTreat for flu 10%60% 56% 95%25%

12
Example: Rapid test for influenza Finally, what if someone comes in with fever and cough but it isn't flu season. Their pretest probability is only about 5%. In this situation, you wouldn't order a test either, since they are beginning below the test threshold. So, we've learned that pretest probability is important, and that we have to interpret tests and perhaps even act differently in different scenarios. One size does not fit all! 0%100% Test threshold Treatment threshold Flu ruled out Need more infoTreat for flu 10%60% 5%

13
Source: JAMA 1999; 282(11): 1064 Increasing bias if flaw present Not just any answer, but the right answer
: 1064 Increasing bias if flaw present Not just any answer, but the right answer")
14
Essential Evidence Plus (EE+) www.essentialevidence.com or www.eeplus.mobi/m www.essentialevidence.comwww.eeplus.mobi/m Content 780 disease or symptom topics (ie “Chest pain”, “Strep throat”, “Tinea versicolor”) Plus underlying databases 4000+ POEMs 4000+ Cochrane abstract 2000 H&P calculators 2000 Diagnostic test calculators 350 decision support tools Visual derm expert system
 or Content 780 disease or symptom topics (ie Chest pain , Strep throat , Tinea versicolor ) Plus underlying databases POEMs Cochrane abstract 2000 H&P calculators 2000 Diagnostic test calculators 350 decision support tools Visual derm expert system")
15
Differential diagnosis Lots of books and Web sites with lists Helpful to provide more than just list Examples : Patient with chest pain – what are the possibilities? Patient with cough – what are the possibilities?

16
Differential Diagnosis (EE+)
")
17
Pretest probability No great sources Best is Dutch database Begin with pretest probability among patients in study that looked at patients like those in your practice Important area for research

19
History and Physical: Demo with EE+ In a patient with chest pain, are they having a myocardial infarction? Chest pain myocardial infarction In patient with sore throat, do they have Group A beta-hemolytic strep? Sore throat Group A strep pharyngitis

20
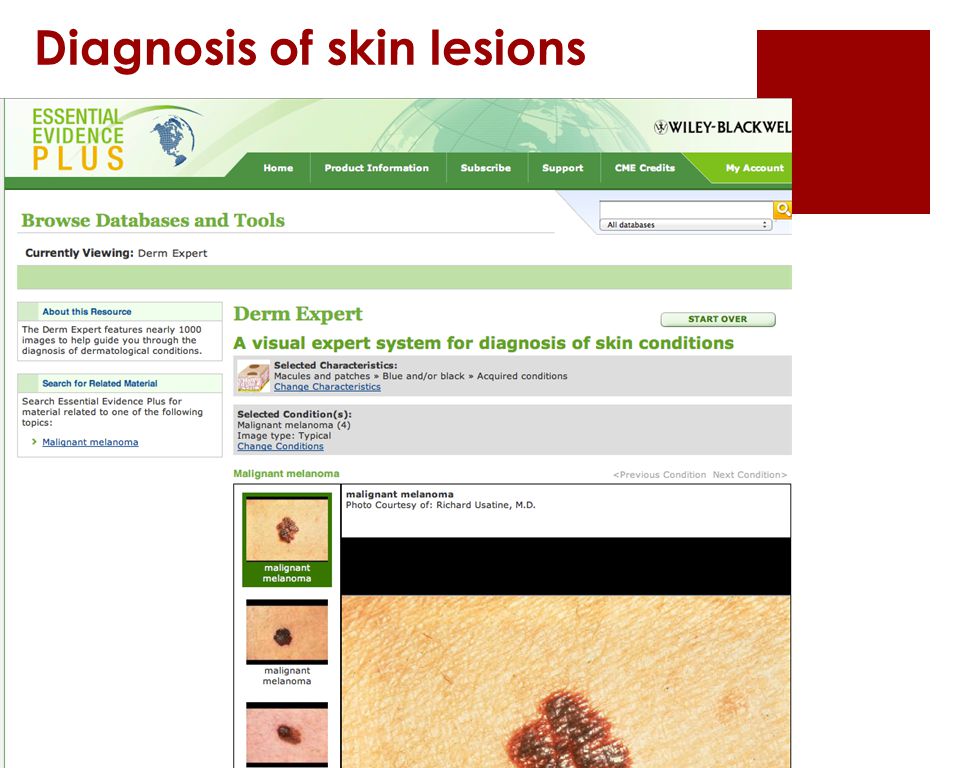
Diagnosis of skin lesions

23
Diagnosis of skin lesions: Demo of EE+

24
Clinical decision rules Combine several elements of the history and physical exam, perhaps including office-based tests Can stratify patients into low, moderate and high risk Good fit for our threshold model 0%100% Test threshold Treatment threshold Do nothingMore information neededTreat

27
Clinical decision rules Strep score Prostate cancer prognosis (“Probability that prostate cancer is indolent”) Many others
 Many others")
28
Diagnostic tests What is the best test to diagnose blood clot in the lung? How accurate is troponin as a test for acute myocardial infarction?

Similar presentations


![INTRODUCTION H1N1 Swine Flu Is Influenza like Illness caused by Virus [H1N1] Was reported from Mexico in 2009 & it had spread to United States and other.](/11/3107319/big_thumb.jpg "INTRODUCTION H1N1 Swine Flu Is Influenza like Illness caused by Virus [H1N1] Was reported from Mexico in 2009 & it had spread to United States and other.>")


, ranging in severity: Acute bronchitis - an acute respiratory tract infection in.>")


 and Pulmonary Embolism (PE)>")

